Figures & data
Figure 1 Graphical formation of 5-Fu-loaded mAb GRP78-NPs and the process of phagocytosis.
Abbreviations: 5-Fu, 5-fluorouracil; EDC, 1-ethyl-3-(3-dimethylaminopropyl) carbodiimide; mAb GRP78-NPs, NPs conjugated with monoclonal antibody against GRP78; NHS, N-hydroxysuccinimide; NPs, nanoparticles.
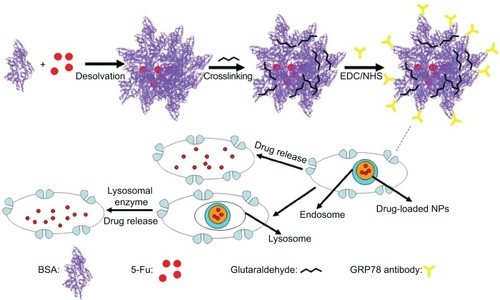
Figure 2 Fluorescence microscope images of identification of mAb GRP78 and IgG in NPs.
Notes: (A) mAb GRP78-NPs; (B) IgG-NPs; (C) unconjugated mAb GRP78 NPs; (D) unconjugated IgG NPs; (E) SEM morphology of mAb GRP78-NPs; (F) SEM morphology of IgG-NPs; (G) 5-Fu release curve showing that mAb GRP78-NPs displayed faster release in pH 7.4 than in pH 5.4.
Abbreviations: 5-Fu, 5-fluorouracil; IgG-NPs, NPs conjugated with IgG; mAb GRP78, monoclonal antibody against GRP78; mAb GRP78-NPs, NPs conjugated with mAb GRP78; NPs, nanoparticles; SEM, scanning electron microscope.
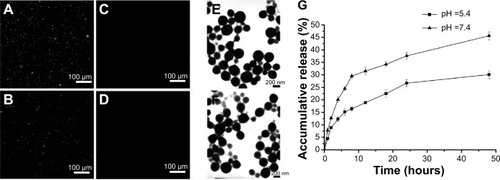
Figure 3 mAb GRP78-NPs inhibited the adhesion and invasion of HCC cells.
Notes: (A) In-cell Western blot assay showed GRP78 expression on the cell surface of SMMC-7721 was higher than that of PLC. (B) Cell adhesion assay showed mAb GRP78-NPs inhibited the adhesion of SMMC-7721 and PLC to different degrees. (C) Assessment of tumor invasion showed mAb GRP78-NPs inhibited the invasion of SMMC-7721 and PLC to different degrees. (D) The inhibition rate of SMMC-7721 cells is higher than that of PLC cells due to targeting cell surface GRP78 with mAb GRP78-NPs. Results are expressed as means ± SD (n=3), *P<0.05.
Abbreviations: IgG-NPs, NPs conjugated with IgG; mAb GRP78-NPs, NPs conjugated with monoclonal antibody against GRP78; NPs, nanoparticles; SD, standard deviation.
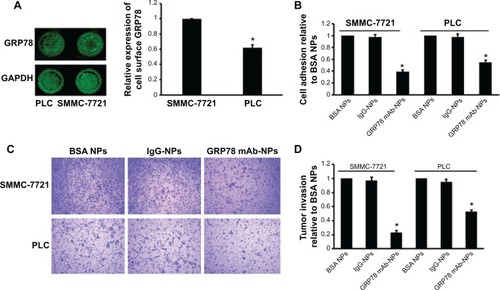
Figure 4 mAb GRP78-NPs could effectively enhance drug accumulation in cells highly expressing GRP78.
Notes: Confocal images of (A) SMMC-7721 and (B) PLC cells after incubation for 6 hours with mAb GRP78-NPs and isotype IgG-NPs. The nucleus was stained with Hoechst (blue) for 15 minutes at 37°C and all NPs were labeled by FITC (green). The cytoskeleton was stained by TRITC-labeled phalloidin. (C) Effects of endocytic inhibitors on the uptaking ability of the two NPs in SMMC-7721 cells. ***P<0.001 versus the IgG group treated with genistein. ###P<0.001 versus the mAb GRP78 group treated with genistein. (D) Effects of endocytic inhibitors on the uptaking ability of the two NPs in PLC cells. ***P<0.001 versus the IgG group treated with genistein. ###P<0.001 versus the mAb GRP78 group treated with genistein. Blocking by using cytochalasin D or chlorpromazine could inhibit the obviously internalizing effect of both NPs. Conversely, addition of genistein into both cells seemed to have little effect on the uptake of either NP.
Abbreviations: FITC, fluorescein isothiocyanate; IgG-NPs, NPs conjugated with IgG; NP, nanoparticle; mAb GRP78, monoclonal antibody against GRP78; mAb GRP78-NPs, NPs conjugated with mAb GRP78; SD, standard deviation; TRITC, tetramethylrhodamine.
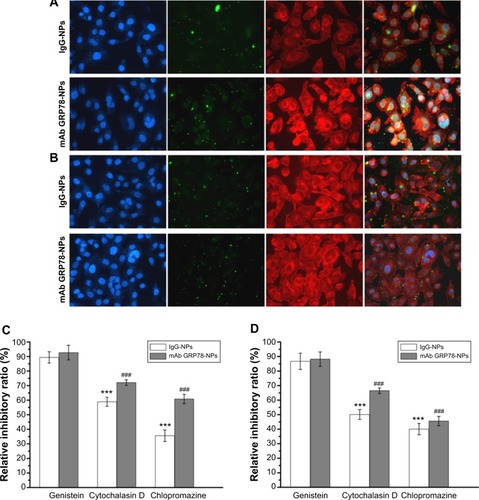
Figure 5 Cell viability analysis.
Notes: (A) Viability of SMMC-7221 cells after incubation with different amounts of naked NPs for 48 hours (n=3). The naked NPs did not inhibit the viability of SMMC-7721. (B) Viability of PLC cells after incubation with different amounts of naked NPs for 48 hours (n=3). NPs did not inhibit the viability of PLC. (C) SMMC-7721 cell viability cultured with 5-Fu-loaded NPs at different concentrations of 5-Fu (3.75 μg/mL, 7.5 μg/mL, 15 μg/mL, 22.5 μg/mL, 30 μg/mL) in medium after 48 hours. (D) PLC cell viability of free 5-Fu, 5-Fu loaded IgG-NPs, and 5-Fu-loaded mAb GRP78-NPs at various concentrations of 5-Fu (3.75 μg/mL, 7.5 μg/mL, 15 μg/mL, 22.5 μg/mL, 30 μg/mL) in medium after 48 hours. Data are presented as means ± SD (n=3). Compared with PLC cells, mAb-NPs facilitated the apoptosis of SMMC-7721, which had highly expressed GRP78 at the cell surface.
Abbreviations: 5-Fu, 5-fluorouracil; IgG-NPs, NPs conjugated with IgG; mAb GRP78-NPs, NPs conjugated with monoclonal antibody against GRP78; NPs, nanoparticles; SD, standard deviation.
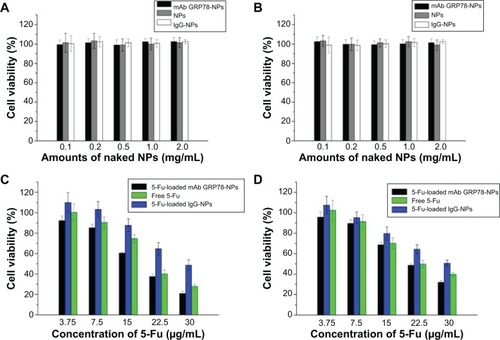
Figure 6 Cell apoptosis determined by annexin V–FITC staining.
Notes: (A and B) Flow cytometer analysis of the apoptotic and necrotic cells after 48 hours’ incubation with free 5-Fu, 5-Fu-loaded mAb GRP78-NPs, and 5-Fu-loaded IgG-NPs. Results are expressed as means ± SD (n=3). (A) SMMC-7721 cells. (B) PLC cells. Western blot analyses of the expression levels of caspase-3 proteins in (C) SMMC-7721 and (D) PLC cells.
Abbreviations: 5-Fu, 5-fluorouracil; FITC, fluorescein isothiocyanate; IgG-NPs, NPs conjugated with IgG; mAb GRP78-NPs, NPs conjugated with monoclonal antibody against GRP78; NPs, nanoparticles; PI, propidium iodide; SD, standard deviation; FLH-1, AV; FLH-2, PI.
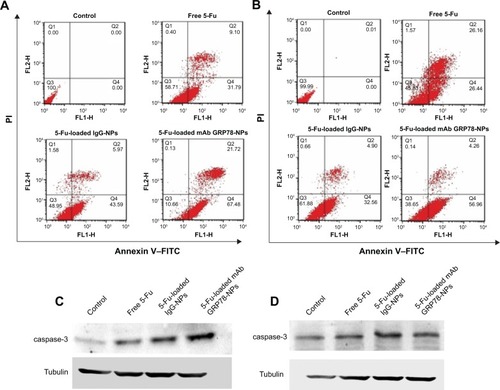
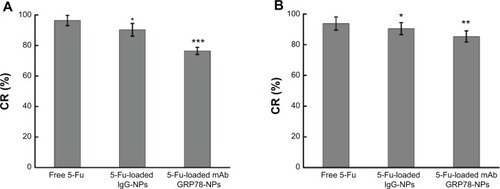
Figure 7 Intracellular adenosine triphosphate level assay after 48 hours’ incubation with free 5-Fu, 5-Fu-loaded mAb GRP78-NPs, and 5-Fu-loaded IgG-NPs.
Notes: (A) SMMC-7721 cells. *P<0.05, ***P<0.001 versus the free 5-Fu group. (B) PLC cells. *P<0.05, **P<0.01 versus the free 5-Fu group. Results are expressed as means ± SD (n=3).
Abbreviations: 5-Fu, 5-fluorouracil; CR, changing rates of intracellular ATP level; IgG-NPs, NPs conjugated with IgG; mAb GRP78-NPs, NPs conjugated with monoclonal antibody against GRP78; NPs, nanoparticles; SD, standard deviation.