Figures & data
Figure 1 Internalization pathways of PAA-coated Co-ferrite NPs observed with TEM in three cell types: CHO cells (A, D, G), B16 cells (B, E, H), and MYO cells (C, F, I).
Notes: For all three cell types, two endocytic pathways were observed, namely macropinocytosis (A–C) and clathrin-dependent endocytosis, for which CCP (D–F) and CCV (G–I) were observed. Scale bars correspond to 1 μm in panels (A and B), 500 nm in (C), and 250 nm in (D–I).
Abbreviations: B16, mouse melanoma cell line; CCV, clathrin-coated vesicles; CHO, Chinese Hamster Ovary cell line; Co-ferrite, cobalt ferrite; CCP, clathrin-coated pits; MYO, primary human myoblasts; NP, nanoparticle; PAA, polyacrylic acid; TEM, transmission electron microscope.
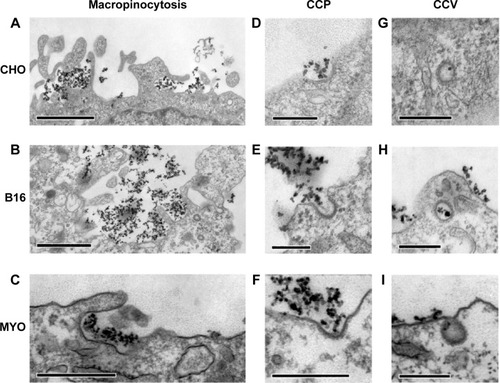
Figure 2 Caveolae in MYO cells after 48 hours’ incubation with PAA-coated Co-ferrite NPs observed with TEM.
Notes: No NPs were observed in the caveolae. Scale bar corresponds to 1 μm.
Abbreviations: Co-ferrite, cobalt ferrite; MYO, primary human myoblasts; NP, nanoparticle; PAA, polyacrylic acid; TEM, transmission electron microscope.
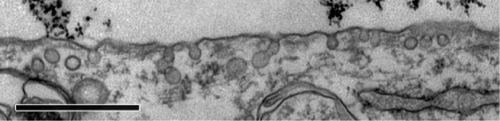
Figure 3 Intracellular trafficking of PAA coated Co-ferrite NPs as observed with TEM in three selected cell types: CHO cells (A, D, G, J), B16 cells (B, E, H, K), and MYO cells (C, F, I, L).
Notes: Internalized NPs took the same intracellular trafficking route in all observed cells: inside the cytosol, NPs were found in early endosomes (A–C), late endosomes (D–F), amphisomes (G–I), and also lysosomes (J–L). Scale bars correspond to 250 nm in Figures (A–H, J–L) and to 1 μm in Figure (I).
Abbreviations: B16, mouse melanoma cell line; CHO, Chinese Hamster Ovary cell line; Co-ferrite, cobalt ferrite; MYO, primary human myoblasts; NP, nanoparticle; PAA, polyacrylic acid; TEM, transmission electron microscope.
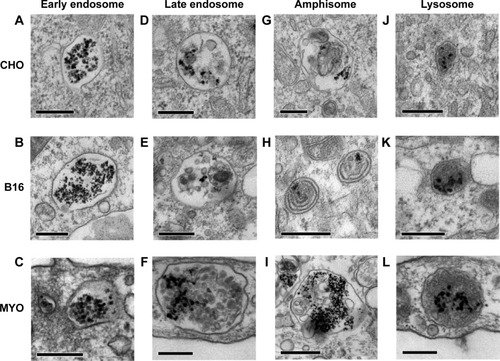
Figure 4 Time-dependent intracellular localization of PAA-coated Co-ferrite NPs in three observed cell types: (1) CHO cell line, (2) B16 cell line, and (3) MYO cells after 1 or 24 hours of incubation with RITC-labeled NPs.
Notes: Figure shows cells under (A) phase contrast, (B) fluorescence of RITC-labeled NPs, (C) fluorescence of acidic organelles stained with LysoTracker® Blue, and (D) colocalization of RITC and LysoTracker® Blue signals. Scale bars correspond to 25 μm.
Abbreviations: B16, mouse melanoma cell line; CHO, Chinese Hamster Ovary cell line; Co-ferrite, cobalt ferrite; NP, nanoparticle; MYO, primary human myoblasts; PAA, polyacrylic acid; RITC, rhodamine B isothiocyanate.
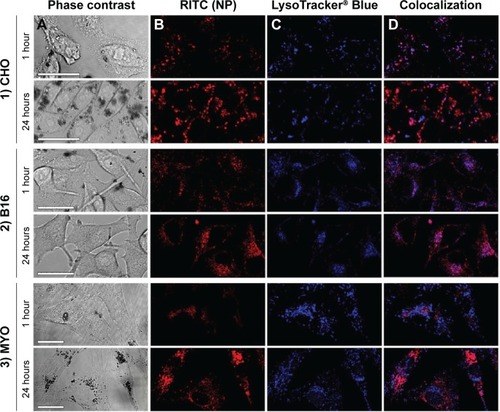
Figure 5 Intracellular localization of PAA-coated Co-ferrite NPs after 24 hours’ incubation as observed with TEM in three cell types: CHO cell line (A, D), B-16 cell line (B, E), and MYO cells (C, F).
Notes: Several large vesicles containing NPs were observed in all three cell types. Scale bars correspond to 2 μm in (A–C) and to 0.5 μm in (D–F).
Abbreviations: B16, mouse melanoma cell line; CHO, Chinese Hamster Ovary cell line; Co-ferrite, cobalt ferrite; MYO, primary human myoblasts; NP, nanoparticle; PAA, polyacrylic acid; TEM, transmission electron microscope.
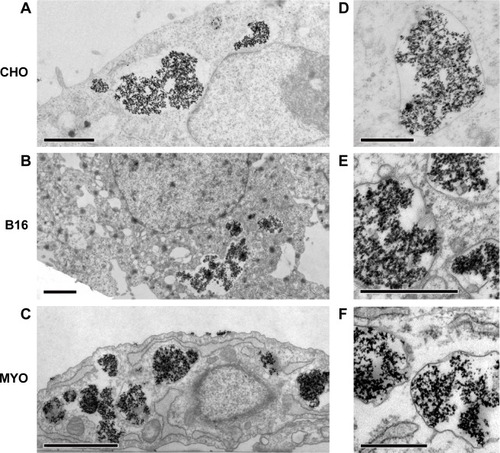
Figure 6 Quantification of time-dependent uptake of RITC-labeled PAA-coated NPs.
Notes: CHO, B16, and MYO cells were incubated with 100 μg/mL NPs for different time intervals (0, 2, 6, 12, 24, and 48 hours), and fluorescence intensity was measured spectrofluorimetrically. Results are presented as measured RITC fluorescence normalized to the highest measured fluorescence in each experiment (MYO cells after 48 hours of incubation). Mean and standard error are shown for four independent experiments. Statistical differences between all three cell types for each time point are shown in the table on the right. Statistical significance is displayed as follows: ns is not significant (P>0.05); *P≤0.05; ***P≤0.001; ****P≤0.0001.
Abbreviations: B16, mouse melanoma cell line; CHO, Chinese Hamster Ovary cell line; MYO, primary human myoblasts; NP, nanoparticle; PAA, polyacrylic acid; RITC, rhodamine B isothiocyanate.
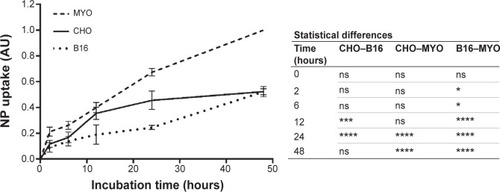
Figure 7 Viability of cells after (A) 24 hours or (B) 96 hours exposure to increasing concentration of PAA-coated Co-ferrite NPs for CHO cell line, B16 cell line, and MYO cells.
Notes: In both cases, viability was determined with PI viability assay. The results are presented as the percentage of viable cells compared with the number of cells in the control sample for each cell type. Mean and standard error are shown for three independent experiments. *Statistical difference corresponds to P≤0.05.
Abbreviations: B16, mouse melanoma cell line; CHO, Chinese Hamster Ovary cell line; Co-ferrite, cobalt ferrite; MYO, primary human myoblasts; NP, nanoparticle; PAA, polyacrylic acid; PI, propidium iodide.
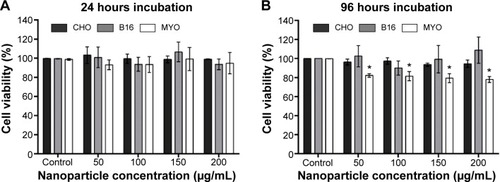
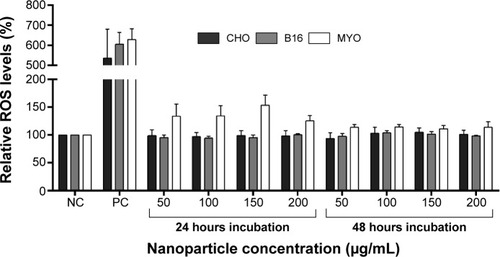
Figure 8 Relative ROS levels for CHO, B16, and MYO cells incubated with increasing concentrations of PAA-coated NPs for 24 and 48 hours as spectrofluorimetrically determined by CM-H2DCFDA assay.
Notes: NC represents untreated cells, while cells in PC were exposed to 500 μM H2O2 for 1 hour. Values are presented as a percentage of ROS in treated cells compared to negative control. Mean and standard error are shown for three independent experiments.
Abbreviations: B16, mouse melanoma cell line; CHO, Chinese Hamster Ovary cell line; CM-H2DCFDA, 5-(and-6)-chloromethyl-2′,7′-dichlorodihydrofluorescein diacetate; MYO, primary human myoblasts; NC, negative control; NP, nanoparticle; PAA, polyacrylic acid; PC, positive control; ROS, reactive oxygen species.