Figures & data
Figure 1 Schematic drawing of the silver nanoparticles–chitosan composite spheres synthesis.
Notes: Droplets were pushed out from pin tip of a pump-driven syringe and then dropped into an NaOH solution, which was used for silver nanoparticles’ reduction and chitosan solidification. Silver nanoparticles–chitosan composite spheres were formed in 15 minutes. The distance between solidifying liquid surface and the tip was one centimeter. The diameter of the needle of the syringe was 8.73 mm.
Abbreviations: AgNO3, silver nitrate; NaOH, sodium hydroxide.
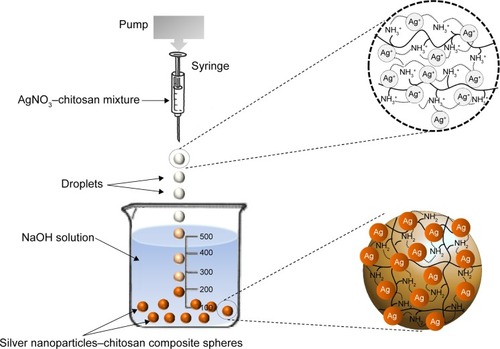
Table 1 The relationship between average diameter of fabricated silver–chitosan composite spheres and the concentration of silver nitrate (AgNO3)
Figure 2 Photographs of the synthesized spheres.
Notes: (A) Chitosan spheres. (B) Silver nanoparticles–chitosan composite spheres synthesized with 1 mM AgNO3. (C) Silver nanoparticles–chitosan composite spheres synthesized with 8 mM AgNO3. The concentration of chitosan was 2%. All scale bars are 2 mm.
Abbreviation: AgNO3, silver nitrate.
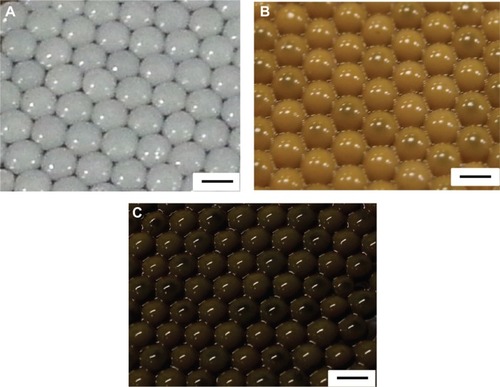
Figure 3 The UV-Vis absorbance spectra of the synthesized silver–chitosan composite spheres at various concentrations of AgNO3 solution.
Abbreviations: AgNO3, silver nitrate; NaOH, sodium hydroxide; au, arbitrary unit; UV-Vis, ultraviolet-visible spectroscopy.
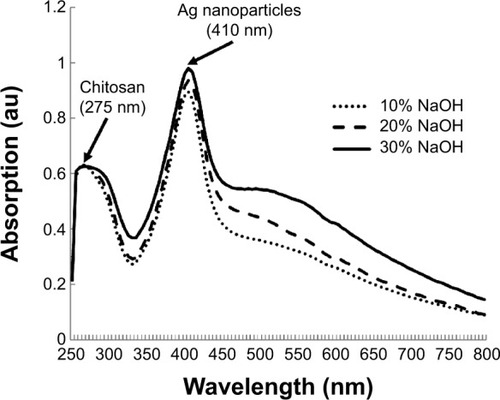
Figure 4 Characterization of silver nanoparticles–chitosan composite spheres by FTIR and XRD.
Notes: (A) The FTIR spectrum, a represents Ag@chitosan, b represents chitosan and (B) the XRD graphs of the fabricated silver nanoparticles–chitosan composite spheres.
Abbreviations: FTIR, Fourier transform infrared spectroscopy; XRD, X-ray diffraction; au, arbitrary unit.
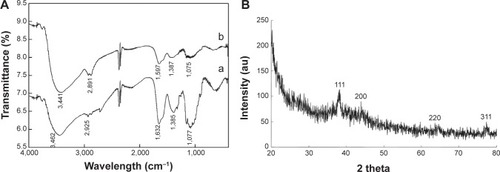
Figure 5 The SEM photographs of the synthesized silver nanoparticles–chitosan composite spheres.
Notes: Panel (A) is the SEM photograph of a whole sphere. Panels (B) and (C) are the “zoom-in” counterparts of (A). Panel (D) is the SEM photograph of a sectioned sphere. Panels (E) and (F) are the “zoom-in” counterparts of (D). The scale bars are 1 mm (A and D), 100 μm (B and E), and 50 μm (C and F), respectively.
Abbreviation: SEM, scanning electron microscopy.
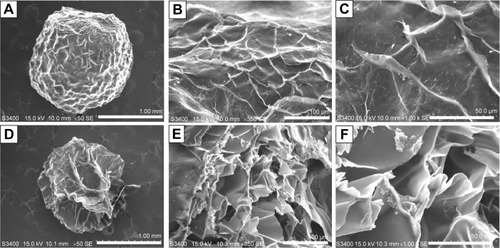
Figure 6 Ag@chitosan anti-fungal effect.
Notes: (A) Flow chart of silver nanoparticles’ anti-fungal effect. (B) and (C) the anti-fungal effect of chitosan microspheres and Ag@chitosan. *P<0.05, **P<0.01.
Abbreviations: Ag@chitosan, silver nanoparticles–chitosan composite spheres; Cm, C. militaris; Ac, A. cinnamomea; BCRC, Biore source Collection and Research Center.
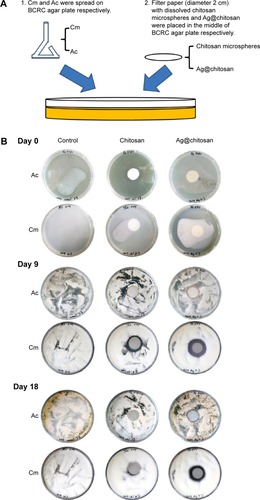
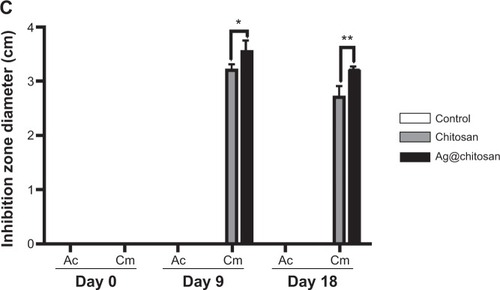
Figure S1 The transmission electron microscopy photograph of the synthesized silver nanoparticles.
Notes: The silver nanoparticles–chitosan composite sphere was granulated, uniformly dispersed in water. The scale bar is 100 nm.
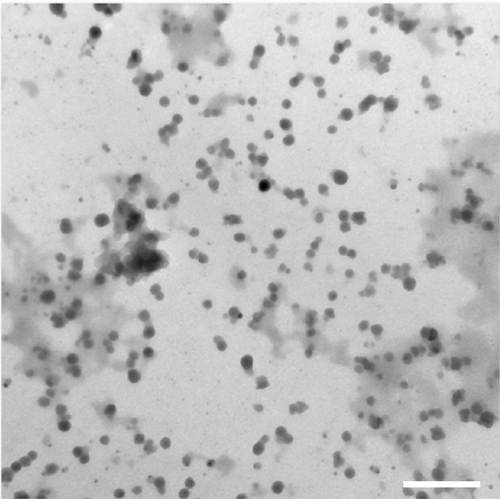
Figure S2 The transmission electron microscopy (SEM) photographs of the synthesized chitosan spheres.
Notes: Panel (A) is an SEM photograph of a whole chitosan sphere. Panels (B) and (C) are the “zoom-in” counterparts of (A). Panel (D) is an SEM photograph of a sectioned chitosan sphere. Panels (E) and (F) are the “zoom-in” counterparts of (D). The scale bars are 1 mm for (A) and (D), 100 μm for (B) and (E), and 50 μm for (C) and (F), respectively.
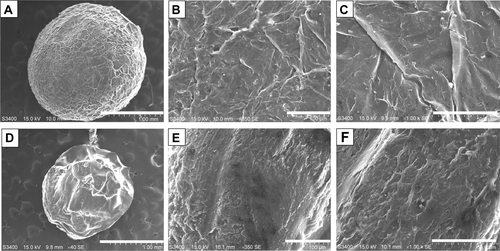
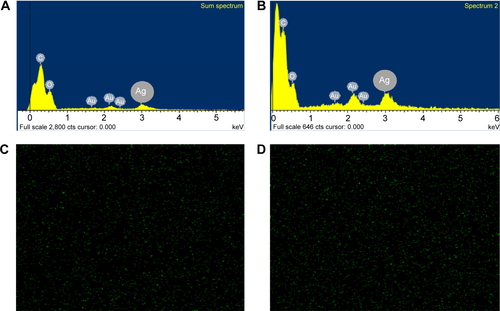
Figure S3 The SEM-EDS mappings of silver nanoparticles deposited on the outer surface (A, C) and inside (B, D) of the synthesized silver nanoparticles–chitosan composite sphere.
Abbreviation: SEM-EDS, scanning electron microscopy–energy dispersive spectroscopy.