
Figures & data
Figure 1 Protocol for quantification of protein binding to TiO2 NTs/Ti foil.
Abbreviations: oxIgG, oxygenized IgG; NTs, nanotubes; PBS, phosphate buffered saline; SAA, serum amyloid A.
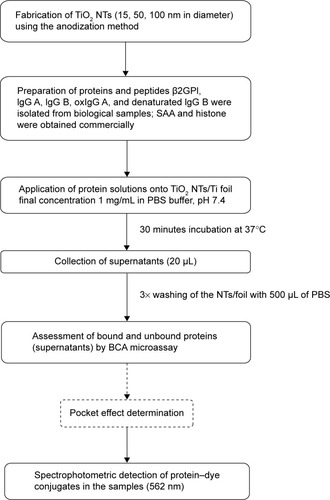
Figure 2 Schematic representation of immunofluorescent detection of SAA protein binding to TiO2 nanotubes.
Abbreviation: SAA, serum amyloid A.
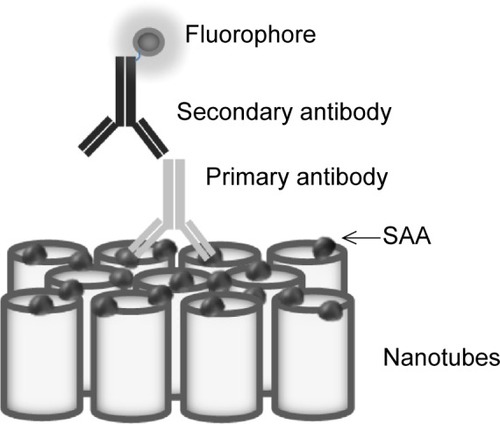
Figure 3 Scanning electron microscope images of the top surface of TiO2 nanotubes of different diameters.
Notes: (A) 100 nm, (B) 50 nm, (C) 15 nm, and (D) titanium foil. Scale bar is 500 nm.
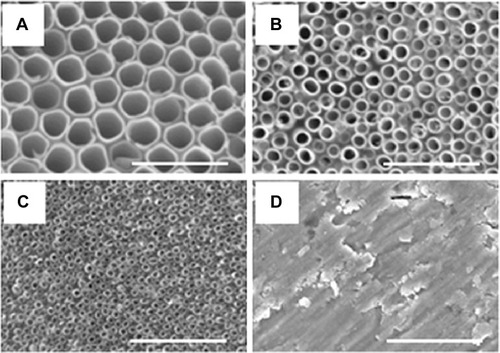
Figure 4 Transmission electron microscopy images of the TiO2 NTs.
Notes: (A–D) Represents the NTs with 15 nm diameters; (E–H) represents the NTs with 50 nm diameters; and (I–L) represents the NTs with 100 nm diameters.
Abbreviation: NTs, nanotubes.
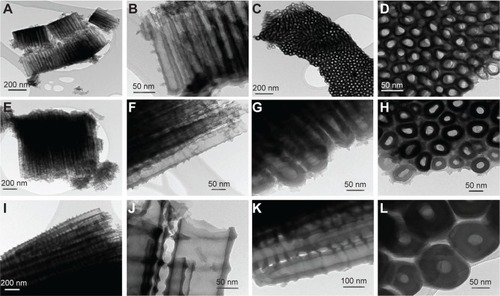
Figure 5 ζ-potential curves of the TiO2 NTs (with 15 nm, 50 nm, and 100 nm diameters) as a function of pH in water.
Abbreviation: NTs, nanotubes.
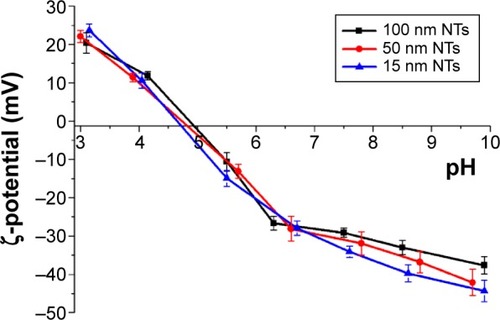
Table 1 Zeta potential values of NT 100 nm in various concentrations of salts in PBS
Figure 6 ζ-potential of NTs obtained from experiments (points) and theoretical (curves) consideration in dependence of monovalent salt concentration in PBS buffer solution.
Notes: The theoretical values of ζ-potential were calculated at three different values of the distance from the charged plane (x1): 1.0 nm (red dotted line), 1.2 nm (blue dashed line), and 1.4 nm (green full line). Other model parameters are: water dipole moment p0 =3.1 D, bulk concentration of water now/NA =55 mol/L, temperature =298 K, surface charge density σ=−0.1 As/m2, and distance of closest approach =0.4 nm.Citation60,Citation63 Inset: graphical presentation of Stern and diffuse electric double layer. Outer Helmholtz plane is located at x=b (distance of closest approach) which is approximately equal to the hydrated radius of the counter-ions. ζ-potential plane is calculated at the distance x=x1 from the negatively charged surface located at x=0.
Abbreviations: c, salt concentration; PBS, phosphate buffered saline.
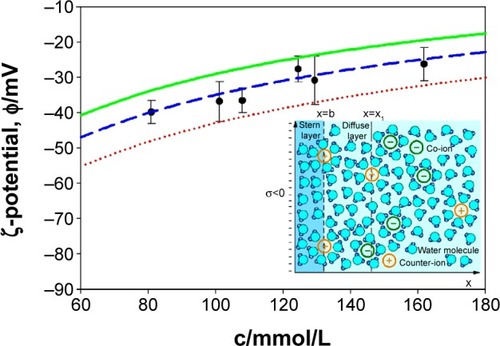
Table 2 Binding of different proteins/peptides to 100, 50, and 15 nm NTs
Figure 7 Relative value (normalized to 100 nm NT) of bound protein mass of different plasma proteins and histone IIA.
Notes: Three independent experiments for all proteins were performed. The results were analyzed with two-way analysis of variance and Bonferroni posttests, and significance was determined as follows: *P<0.05, **P<0.01, ***P<0.001.
Abbreviations: β2GPI, β2-glycoprotein I; NT, nanotube; oxIgG A, oxidized IgG A; SAA, serum amyloid A.
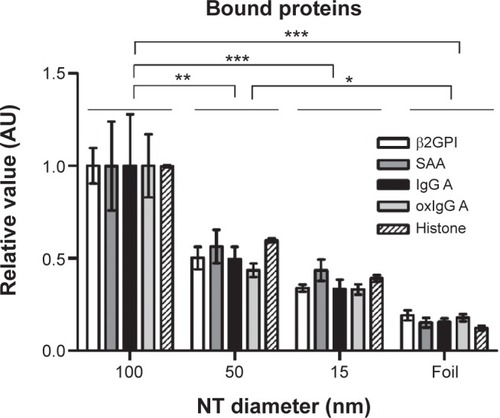
Figure 8 Bound protein mass of native and denaturated IgG B on 100, 50, and 15 nm NTs and foil.
Notes: (A) Native IgG B bound protein mass. (B) Denatured IgG B bound protein mass. Two-way analysis of variance and Bonferroni posttests were used to determine significance: ***P<0.001, **P<0.01, *P<0.05. Five independent experiments for native IgG B and four for denaturated IgG B were performed.
Abbreviation: NT, nanotube.
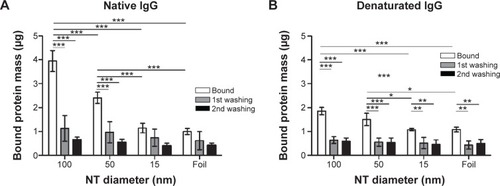
Figure 9 Dose-dependent binding of SAA to 100 nm NTs and foil using BCA protein assay.
Notes: (A) SAA protein bound to 100 nm NTs. (B) SAA protein bound following the first washing of the protein indicating the pocket effect. Two-way analysis of variance and Bonferroni posttests were used to determine significance: ***P<0.001, **P<0.01. The bars represent the average of three independent experiments performed.
Abbreviations: NTs, nanotubes; SAA, serum amyloid A.
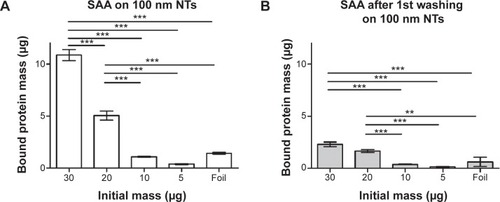
Figure 10 SAA dose dependently binds to NTs with different diameters.
Notes: (A) Immunofluorescence of bound SAA. (B) Average of intensity in arbitrary units was measured and compared with different NT diameters. Two way analysis of variance and Bonferroni posttests were used to determine significance: ***P<0.001, **P<0.01, *P<0.05. Four independent experiments for each concentration and NT diameter were performed.
Abbreviations: NTs, nanotubes; SAA, serum amyloid A.
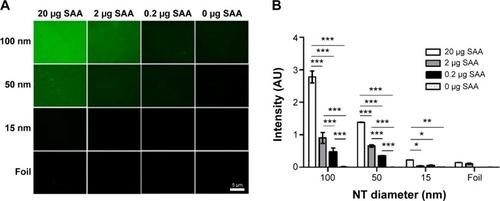
Table 3 Calculated NT surface and edges area, and distances between NTs with different diameters
Table 4 Protein IEPs, charge, wettability, and other attributes as determined by IEP calculator, Peptide Property Calculator GenScript2014, and literature