Figures & data
Figure 1 Characterization of ME100 fractions produced by high energy milling and differential centrifugation.
Notes: (A) Scanning electron microscopy of the different particle fractions. (B) Intensity size distributions of the milled and unmilled ME100 nanoparticles measured by dynamic light scattering.
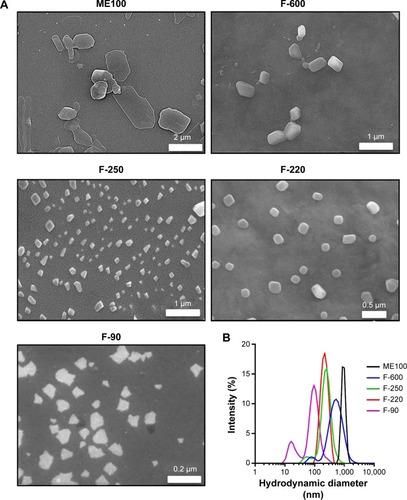
Figure 2 Concentration-dependent effects of the various nanoparticle fractions on cell viability following 24 hour exposure.
Notes: (A) dTHP-1 cells. (B) RAW cells. (C) HeLa cells. Results are mean ± standard deviation n=3.
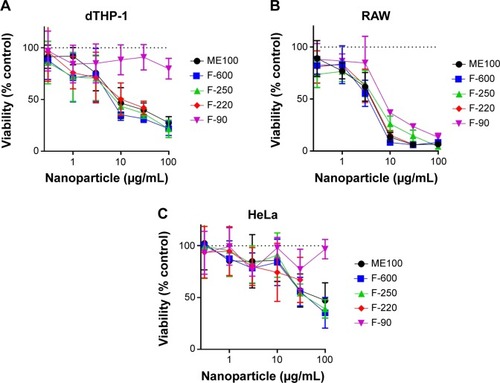
Figure 3 Time-dependent effects of the various nanoparticle fractions (30 μg/mL) on cell viability.
Notes: (A) dTHP-1 cells. (B) RAW cells. Results are mean ± standard deviation n=3.
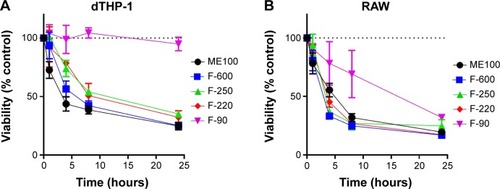
Figure 4 Membrane integrity and cell apoptosis following nanoparticle exposure.
Notes: (A) dTHP-1 and RAW cells were treated with 30 μg/mL nanoparticles for 4 hours. Data are plotted as percent total lactate dehydrogenase (determined with 1% TritionX-100) versus the mean hydrodynamic diameter for each fraction. (B) Apoptotic cells following treatment with 30 μg/mL nanoparticles for 4 hours determined by annexin V staining. Results are mean ± standard deviation n=3. Statistical comparisons were performed using a Student’s t-test.
Abbreviations: LDH, lactate dehydrogenase; NS, not significant.
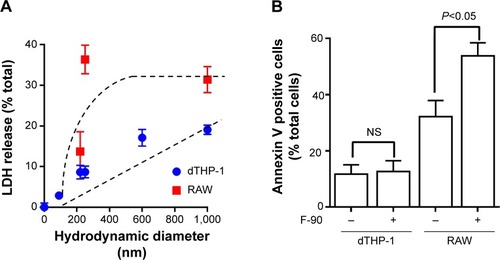
Figure 5 Uptake of nanoparticles by dTHP-1 and RAW cells.
Notes: (A) YOYO-1 labeled nanoparticles (10 μg/mL) were incubated with each cell line in complete medium for 4 hours. Total cell-associated fluorescence was determined by flow cytometry. Results are mean ± standard deviation n=3. *Indicates significantly different to ME100. (B) Effect of polyinosinic acid on cell uptake of each nanoparticle fraction. Results are mean ± standard deviation; n=3 where control cells were those not treated with polyinosinic acid.
Abbreviation: au, arbitrary units.
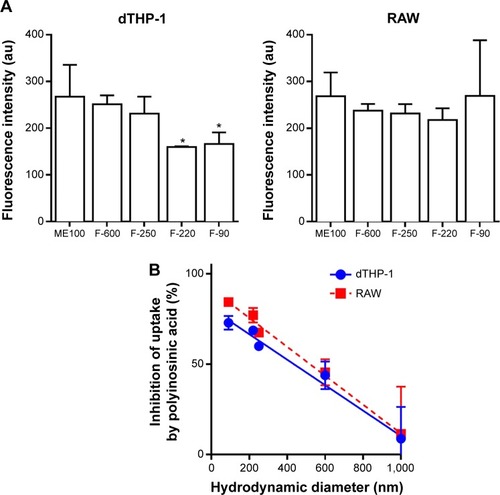
Figure 6 Confocal microscopy of dTHP-1 and RAW cells exposed to ME100 or F-90 nanoparticles (10 μg/mL) for 4 hours.
Notes: Green: YOYO-1 labeled nanoparticles; red: phalloidin; blue: DAPI.
Abbreviation: DAPI, 4′,6-diamidino-2-phenylindole.
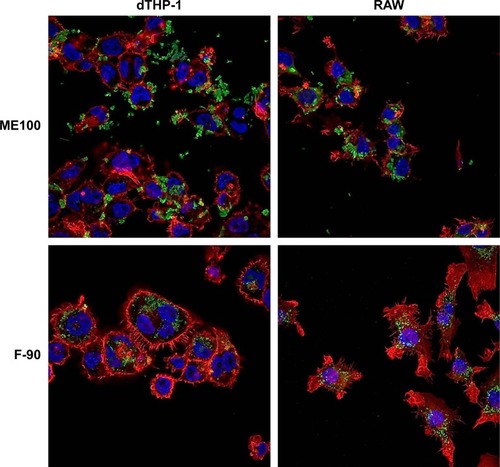
Figure 7 Protein binding to ME100 and F-90 nanoparticles.
Notes: Nanoparticles were incubated with 5%, 40%, and 80% fetal bovine serum (FBS) for 1 hour at 37°C and then washed to remove low affinity proteins. Bound proteins were then extracted in SDS-PAGE reducing buffer. Equal volumes of the SDS buffer were loaded in each lane. Following development, the gel was stained with SyPRO ruby. Arrows indicate proteins that change with increasing serum concentration.
Abbreviation: SDS-PAGE, sodium dodecyl sulfate polyacrylamide gel electrophoresis.
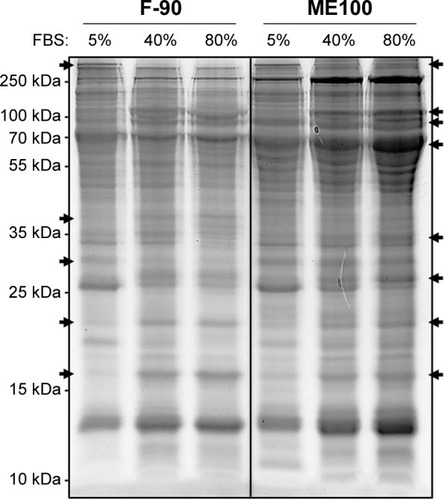
Figure 8 Effect of serum on uptake and toxicity of nanoparticle fractions.
Notes: (A) Uptake of YOYO-1 labeled ME100 and F-90 nanoparticles (10 μg/mL) with increasing serum concentrations in dTHP-1 cells. Open bars: controls; closed bars: cells pretreated with polyinosinic acid. Time-dependent toxicity of ME100 (B) and F-90 (C) nanoparticles in dTHP-1 cells in different concentrations of serum. Results are mean ± standard deviation n=3.
Abbreviations: au, arbitrary units; FBS, fetal bovine serum.
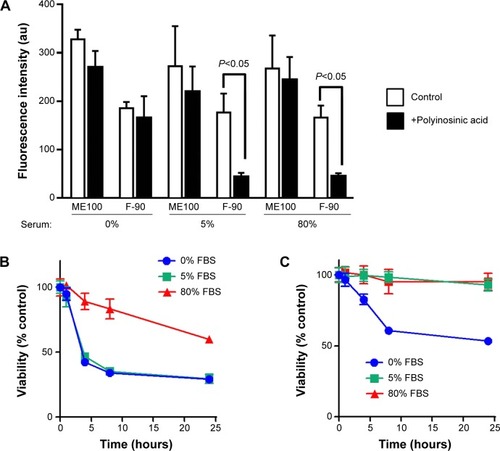
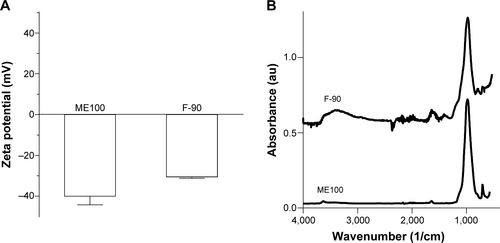
Figure S1 Zeta potential (A) and FTIR spectra (B) for the largest (ME100) and smallest (F-90) particles.
Note: Zeta potentials are plotted as mean ± SEM, n=3.
Abbreviations: au, arbitrary units; FTIR, fourier transform infrared; SEM, standard error of the mean.