Figures & data
Figure 1 Schematic illustration of encapsulation of QT-PBCA NPs by emulsion polymerization.
Abbreviations: QT-PBCA NPs, quercetin-loaded poly(n-butylcyanoacrylate) nanoparticles; P-80, polysorbate-80.
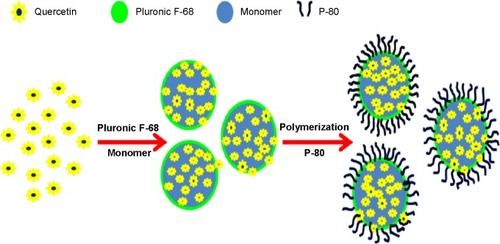
Figure 2 Morphology of encapsulated QT-PBCA NPs and QT-PBCA+P-80.
Notes: Typical particle size distribution graph shows sharp, narrow area peaks indicating the homogeneity of QT-PBCA NPs at 161.1±0.44 nm (A) and QT-PBCA+P-80 at 166.6±0.33 nm (B); Transmission electron microscopy images of QT-PBCA NPs (C) and QT-PBCA+P-80 (D) at 30,000×.
Abbreviations: QT-PBCA NPs, quercetin-loaded poly(n-butylcyanoacrylate) nanoparticles; P-80, polysorbate-80.
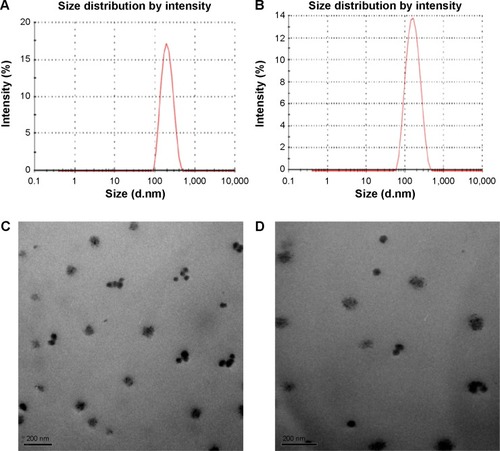
Figure 3 (A) Absorption spectrum of free QT and QT-PBCA NPs; (B) Visual observation of prepared QT-PBCA NPs suspended in water (a) and free QT solution suspended in water (b).
Abbreviations: QT, quercetin; QT-PBCA NPs, quercetin-loaded poly(n-butylcyanoacrylate) nanoparticles.
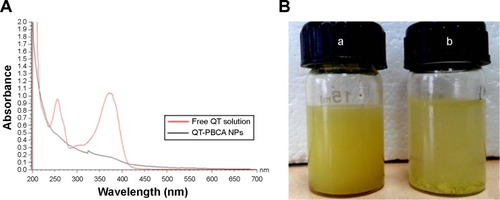
Figure 4 FTIR spectrum of n-BCA monomer (A), blank PBCA NPs (B), QT-PBCA NPs (C), and free QT (D).
Notes: A,B and C arrow indicates a C=N peak at 2,249.83 cm−1 on n-BCA is also present in the spectra of blank PBCA NPs and QT-PBCA NPs, indicating that C=N did not take part in the polymerization reaction; D arrow indicates a major characteristic broader bands corresponding to the OH phenolic stretch at 3,385.07 cm−1.
Abbreviations: FTIR, Fourier transform infrared spectroscopy; n-BCA, n-butylcyanoacrylate; PBCA, poly(n-butylcyanoacrylate); NPs, nanoparticles; QT-PBCA NPs, quercetin-loaded poly(n-butylcyanoacrylate) nanoparticles; QT, quercetin.
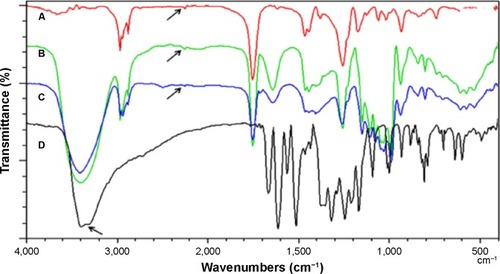
Figure 5 DSC curves of free QT (A), QT-PBCA NPs (B), and blank PBCA NPs (C).
Abbreviations: DSC, differential scanning calorimetry; QT, quercetin; QT-PBCA NPs, quercetin-loaded poly(n-butylcyanoacrylate) nanoparticles; PBCA, poly(n-butylcyanoacrylate); NPs, nanoparticles.
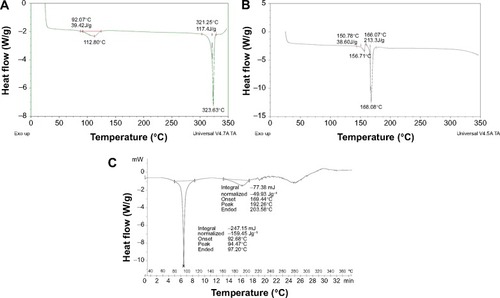
Figure 6 X-ray powder diffraction of free QT (A), QT-PBCA NPs (B), and blank PBCA NPs (C).
Abbreviations: QT, quercetin; QT-PBCA NPs, quercetin-loaded poly(n-butylcyanoacrylate) nanoparticles; PBCA, poly(n-butylcyanoacrylate); NPs, nanoparticles.
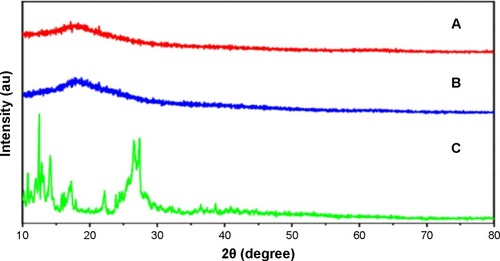
Figure 7 Stability study of free QT, QT-PBCA NPs, and QT-PBCA+P-80 in SGF (A) and SIF (B).
Note: Data are represented as mean ± SD (n=3).
Abbreviations: QT, quercetin; QT-PBCA NPs, quercetin-loaded poly(n-butylcyanoacrylate) nanoparticles; P-80, polysorbate-80; SGF, simulated gastric fluid; SIF, simulated intestinal fluid; SD, standard deviation; h, hours.
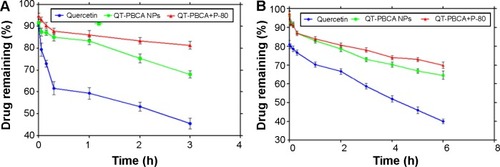
Figure 8 Cumulative release profiles of QT from QT-PBCA NPs and QT-PBCA+P-80 in comparison with the free drug.
Note: Results are presented as mean ± SD (n=3).
Abbreviations: QT, quercetin; QT-PBCA NPs, quercetin-loaded poly(n-butylcyanoacrylate) nanoparticles; P-80, polysorbate-80; SD, standard deviation; h, hours.
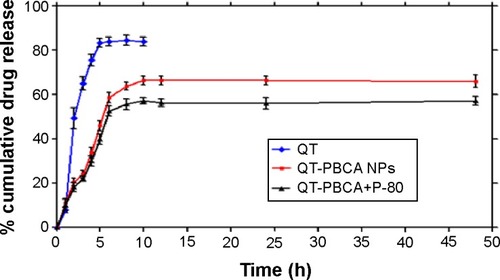
Table 1 Stability study of QT-PBCA NPs
Table 2 Plasma pharmacokinetics parameters of free QT solution, QT-PBCA NPs, and QT-PBCA+P-80, after single oral administration of 50 mg/kg body weight in rats
Figure 9 In vivo mean plasma drug concentration–time profiles of quercetin in rats after oral administration in Wistar rats of free QT, QT-PBCA NPs, and QT-PBCA+P-80.
Note: All values reported are mean ± SD (n=5).
Abbreviations: QT, quercetin; QT-PBCA NPs, quercetin-loaded poly(n-butylcyanoacrylate) nanoparticles; P-80, polysorbate-80; SD, standard deviation; h, hours.
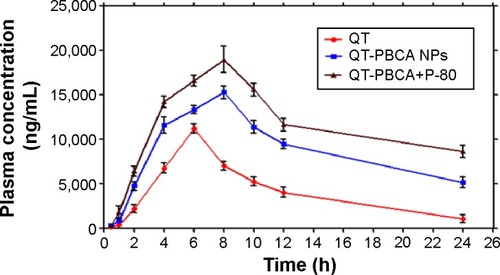
Table 3 Pharmacokinetics parameters of tissue distribution of QT after oral administration of QT solution, QT-PBCA NPs, and QT-PBCA+P-80 to rats with dose of 50 mg/kg
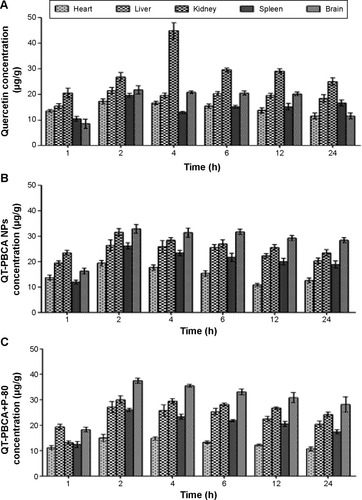
Figure 10 In vivo biodistribution studies on Wistar rats.
Notes: Tissue concentration–time profiles of QT after oral administration of free QT solution (A), QT-PBCA NPs (B), and QT-PBCA+P-80 (C). Data represented as mean ± SD (n=5).
Abbreviations: QT, quercetin; QT-PBCA NPs, quercetin-loaded poly(n-butylcyanoacrylate) nanoparticles; P-80, polysorbate-80; SD, standard deviation; h, hours.