Figures & data
Figure 1 The mechanism of MyD88 acting as an adaptor during TLR signaling transduction in conventional dendritic cells.
Notes: All TLRs, except TLR3, recruit MyD88. MyD88 activates NF-κB and IRFs via complicated interactions, respectively. NF-κB initiates the transcription of proinflammatory cytokines, whereas IRFs initiate the transcription of type I IFNs. The pMyD88/HGPAE complex acts on MyD88 to block the TLR signaling.
Abbreviation: HGPAE, histidine-grafted poly(β-amino ester).
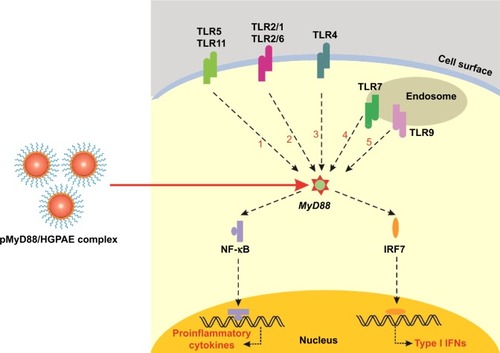
Figure 2 The synthesis process of PAEs and HGPAE.
Note: A positively charged histidine residue was grafted onto PAEs to synthesize HGPAE.
Abbreviations: DCC, N,N′-dicyclohexylcarbodiimide; HGPAE, histidine-grafted PAE; PAE, poly(β-amino ester).
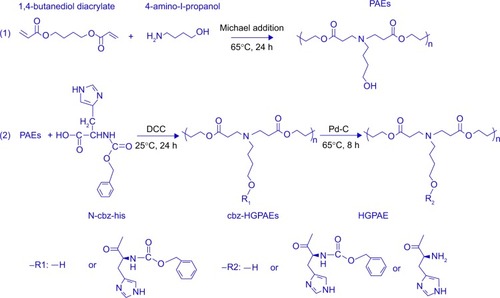
Figure 3 The proton nuclear magnetic resonance spectra of PAEs and HGPAEs.
Notes: The peaks corresponding to signals δ (ppm) 5.9, 6.5, and 2.9 that are characteristic of acrylate-terminated PAEs indicated successful copolymerization of PAEs. Some additional peaks at 7.80–7.83 ppm that are characteristic of histidine were detected on the HGPAE spectrum, which indicated the success of the conjugation of histidine and the chain of PAEs. The lowercase letter labels mean different position of hydrogen on synthetic polymer.
Abbreviations: HGPAE, histidine-grafted PAE; PAE, poly(β-amino ester).
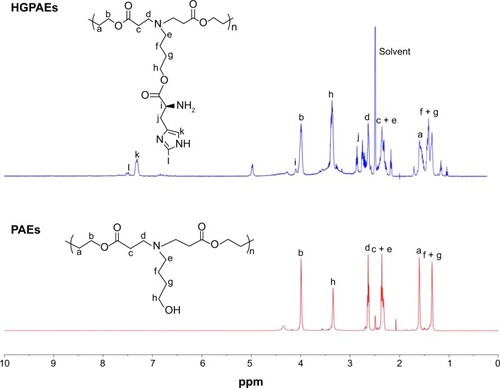
Figure 4 Properties of PAEs and HGPAEs.
Notes: (A) Titration curves obtained by titrating aqueous solutions of PAEs and HGPAEs (0.1 mg/mL) in 0.01 M aqueous NaCl. (B) Derivative curve of the titration profile of HGPAEs and PAEs. (C) Transmittance of HGPAE solution as pH changes.
Abbreviations: HGPAE, histidine-grafted PAE; PAE, poly(β-amino ester).
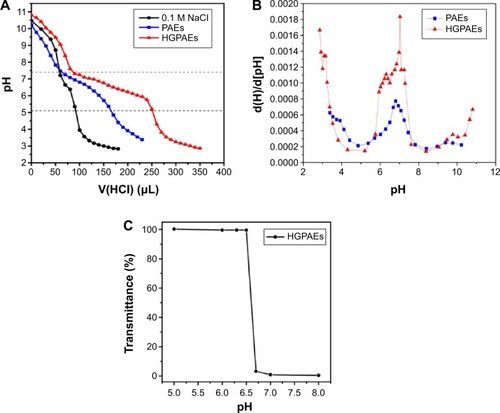
Figure 5 Properties of pHK/HGPAE.
Notes: (A) The weight ratio of HGPAE to pDNA was optimized by agarose gel retardation electrophoresis. (B) The stability of the pDNA/HGPAE complex was investigated by treatment with sodium heparin. (C) The particle size and zeta potential changes of the pHK/HGPAE complex with different weight ratios. (D) Transmission electron microscopy image of the pHK/HGPAE complex at a ratio of HGPAE to pHK of 80:1. (E) The size of the pHK/HGPAE complex under different pH conditions.
Abbreviations: HGPAE, histidine-grafted poly(β-amino ester); V, Vector; P, pDNA.
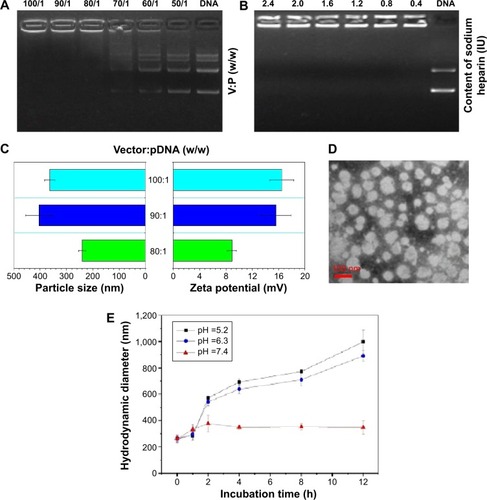
Figure 6 The safety and transfection efficiency of HGPAE in vitro.
Notes: (A) The safety of HGPAE in vitro was tested by MTT. (B) Fluorescent microscopic image of EGFP expression in the pHK/Lipofectamine2000 2,000 group. (C) Fluorescent microscopic image of EGFP expression in the pHK/HGPAE group.
Abbreviations: HGPAE, histidine-grafted poly(β-amino ester); MTT, 3-(4,5-dimethylthiazol-2-yl)-2,5-diphenyltetrazolium bromide.
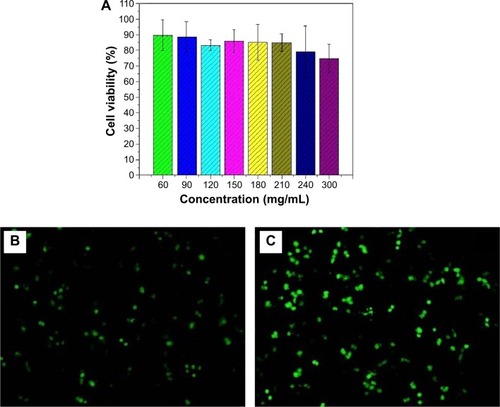
Figure 7 Transfection safety and efficiency of HGPAE in vivo.
Notes: (A) The portal vein. (B) The method of direct portal vein injection for in vivo liver transfection. (C) The changes of liver function and renal function on the first day after in vivo liver transfection. (D) The changes of liver function and renal function on the third day after in vivo liver transfection. (E) Quantitative evaluation of EGFP expression after in vivo liver transfection. *P<0.05; **P<0.01.
Abbreviations: au, arbitrary units; ALT, alanine transaminase; AST, aspartate transaminase; Crea, creatinine; HGPAE, histidine-grafted poly(β-amino ester); TBIL, total bilirubin.
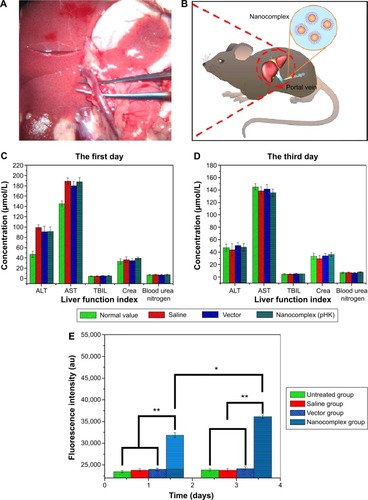
Figure 8 Gene expression of MyD88 after in vivo liver transfection.
Notes: (A) MyD88 mRNAinhibition rate of different groups compared with the saline group. (B) MyD88 protein expression 3 days after in vivo liver transfection was tested by Western blot (a: saline group, b: vector group, c: pHK/PAEgroup, and d: pMyD88/HGPAEgroup). (C) Comparison of MyD88 protein expression among different groups. *P<0.01.
Abbreviation: HGPAE, histidine-grafted poly(β-amino ester).
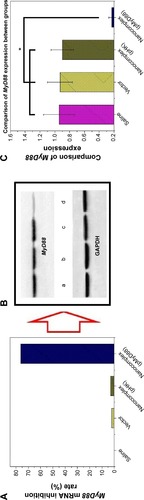
Figure 9 The median survival time of recipients in different groups.
Notes: The survival time of recipients is median survival time and comparisons were made using the Kaplan–Meier cumulative survival method.
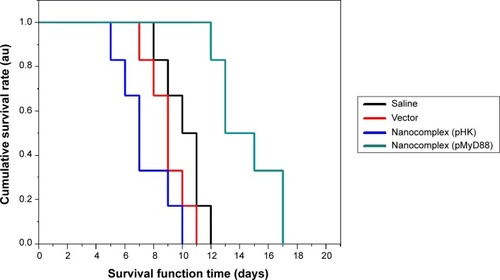
Figure 10 Pathological changes of the donor liver after transplantation.
Notes: (A) Liver tissue sections of the saline group. (B) Liver tissue sections of the HGPAE vector group. (C) Liver tissue sections of the pHK/HGPAE complex group. (D) Liver tissue sections of the pMyD88/HGPAE complex group.
Abbreviation: HGPAE, histidine-grafted poly(β-amino ester).
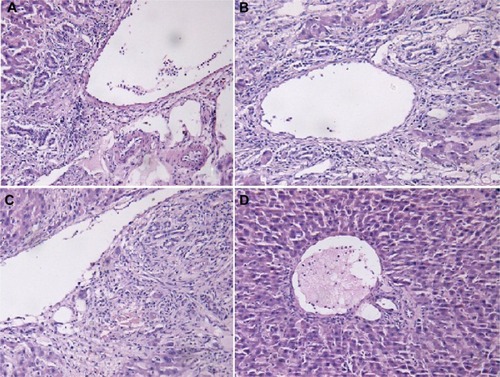
Figure 11 Gene expression of MyD88 after liver transplantation.
Notes: (A) MyD88 mRNAinhibition rate of different groups compared with the saline group. (B) MyD88 protein expression 5 days after liver transplantation was tested by Western blot (a: saline group, b: vector group, c: pHK/PAEgroup, and d: pMyD88/HGPAEgroup). (C) Comparison of MyD88 protein expression among different groups. *P<0.01.
Abbreviation: HGPAE, histidine-grafted poly(β-amino ester).
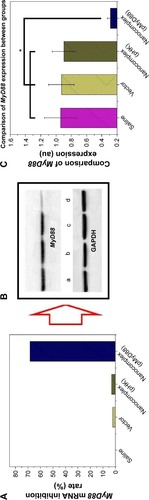
Figure 12 Expression of IL-2 and IFN-γ after liver transplantation.
Notes: (A) The IL-2 serum concentration of different groups detected by ELISA. (B) IFN-γ concentration of different groups detected by ELISA. *P<0.05.
Abbreviation: ELISA, enzyme-linked immunosorbent assay.
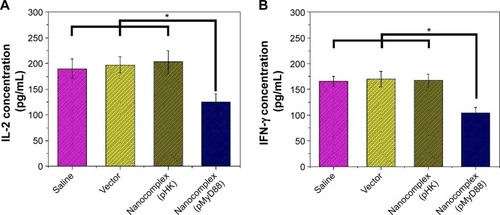
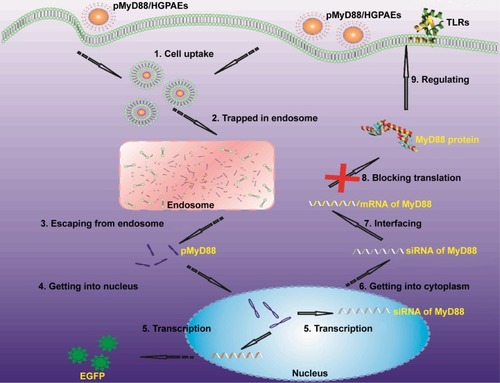
Figure 13 The functional mechanism of the pMyD88/HGPAE complex.
Notes: After being entrapped by the acidic endosome, the pMyD88/HGPAE complex became swollen and disassembled. Then the pMyD88 escaped from the endosome and got into the nucleus to transcript siRNA of MyD88 for suppressing the expression of MyD88.
Abbreviation: HGPAE, histidine-grafted poly(β-amino ester).