Figures & data
Figure 1 Electron micrographs and hydrodynamic diameter (DH) distributions.
Notes: Electron micrographs of ferromagnetic Fe2O3 (A) and ZnO nanoparticles (B). DH distributions of (C) Fe2O3, (D) ZnO and (E) Fe2O3 and ZnO.
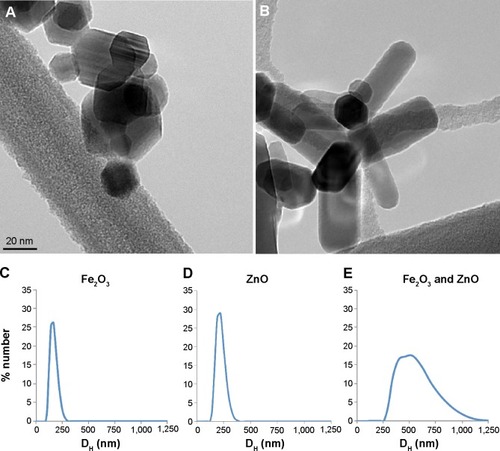
Figure 2 Pharmacokinetics of 65Zn post-intravenous (IV) injection of 65ZnO.
Notes: (A) Total distribution of recovered 65Zn in rat tissues at 0, 7, 14, and 21 days postinjection. (B) Excretion of 65Zn post-IV injection of 65Zn ENPs. (C) Percentage of injected 65Zn dose retained in the liver diminished over time. (D) Overall organ distribution of 65Zn over time post-IV injection of 65ZnO ENPs.
Abbreviation: ENPs, engineered nanoparticles.
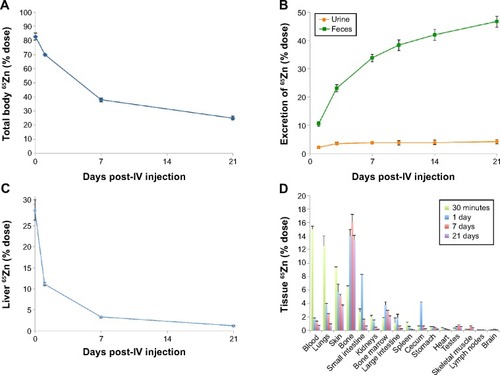
Figure 3 Magnetometric evaluations of Kupffer cells.
Notes: At (A) 30 minutes, (B) 24 hours, and (C) 7 days postinjection of ZnO engineered nanoparticles. rats were intravenously injected with 5 mg/kg each of ZnO engineered nanoparticles and Fe2O3 tracer nanoparticles. At each time point, magnetometric measurements were collected for 30 minutes. Significant slowing in relaxation was observed at 30 minutes and 24 hours compared to control animals (Fe2O3 only; student’s t-test was used to evaluate the B30/B0). At 7 days, relaxation returned to normal when there was a 25% reduction in 65Zn retained in the liver (n=6, P<0.01).
Abbreviation: B0, initial magnetic field strength.
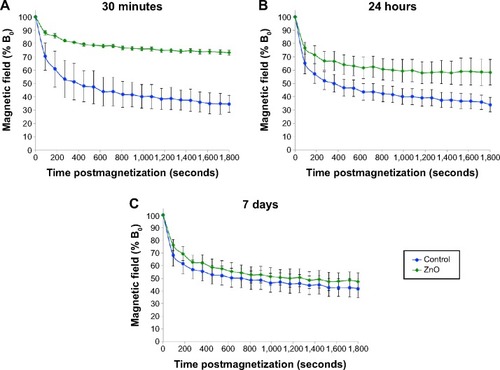
Figure 4 Effect of ZnO ENPs on the fate of IV-injected Pseudomonas aeruginosa.
Notes: (A) Bacterial clearance of Pseudomonas aeruginosa in the blood and tissues. Bacteria were rapidly cleared from the blood. Rats pretreated with ZnO engineered nanoparticles with or without Fe2O3 showed slightly slower clearance for the first 30 minutes, but by 60 minutes there were almost no viable bacteria detected in the blood. (B) At 10 minutes postinjection of bacteria, the majority of the injected dose was found in the liver, spleen, and blood. (C) At 4 hours, very low levels of viable bacteria remained in these organs. (D) Bacterial inactivation in 4 hours. Compared to 10 minutes, viable bacteria (cfu/g) in the liver, lungs, and kidneys were significantly decreased. However, pretreatment of rats with ZnO engineered nanoparticles with or without Fe2O3 did not affect bacterial killing in these organs.
Abbreviations: ENPs, engineered nanoparticles; IV, intravenous.
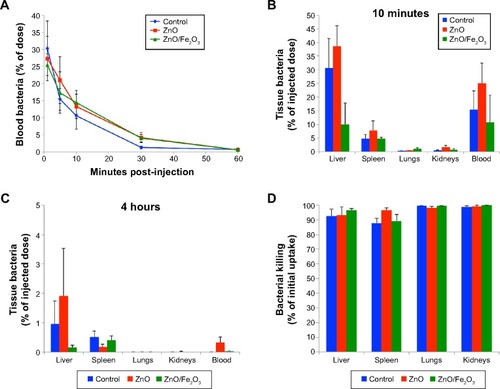
Figure 5 Effect of ZnO engineered nanoparticles (ENPs) on liver function.
Notes: (A) Time-dependent significant increases in aspartate aminotransferase (AST) were observed in rats after intravenous administration of ZnO ENPs. At the higher dose of 20 mg/kg ZnO ENPs, a fivefold increase in AST was observed. However, it had decreased by 7 days. (B) Increases in creatine phosphokinase (CPK) were also found 7 days after ZnO ENP injection. The P-values were determined by one-way ANOVa followed by Bonferroni’s post-hoc test, where *P≤0.05, and ***P≤0.0001 versus baseline.
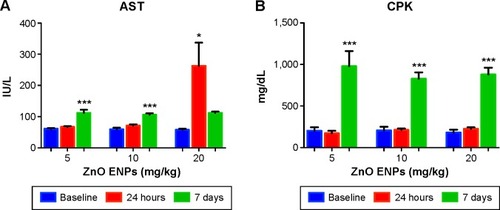
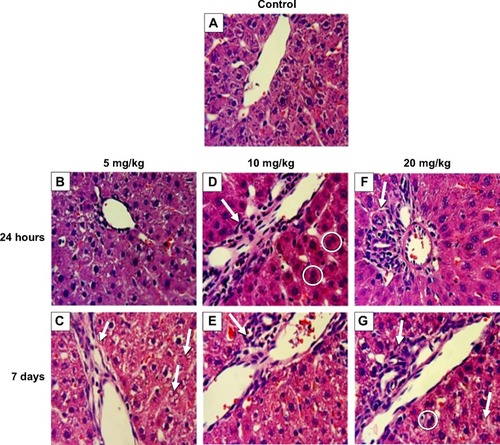
Figure 6 Effect of ZnO nanoparticles on liver histology of male Wistar Han rats.
Notes: (A) Control (intravenously injected with sterile saline). (B) At 24 hours, hepatocyte swelling was evident with an intravenous dose of 5 mg/kg of ZnO engineered nanoparticles (ENPs). (C) After 7 days, granulation and necrotic regions accompanied by neutrophil infiltration were observed; the arrow on the left indicates neutrophil infiltration; the arrows on the right indicate granulation and necrotic regions. (D) At 24 hours, 10 mg/kg ZnO ENPs caused an influx of neutrophils (arrow) and binucleated hepatocytes (circled). (E) At 7 days, inflammation and liver necrosis were evident (arrow). (F) At 24 hours, 20 mg/kg ZnO ENPs induced inflammatory cell infiltration (arrow). (G) At 7 days, inflammatory cell infiltration remained (upper arrow), along with binucleated cells (circled) and some necrosis (lower arrow).