Figures & data
Figure 1 Synthesis and characterization of B-AgNPs and F-AgNPs using culture supernatant of Bacillus tequilensis and culture filtrate of milky mushroom, respectively.
Notes: The formation of AgNPs was confirmed using UV-vis spectroscopy. The absorption spectra of B-AgNPs and F-AgNPs exhibited a strong broad peak at 410 nm, and observation of such a band is assigned to surface plasmon resonance of the particles.
Abbreviations: AgNPs, silver nanoparticles; B-AgNPs, bacterium-derived AgNPs; F-AgNPs, fungus-derived AgNPs; UV-vis, ultraviolet-visible.
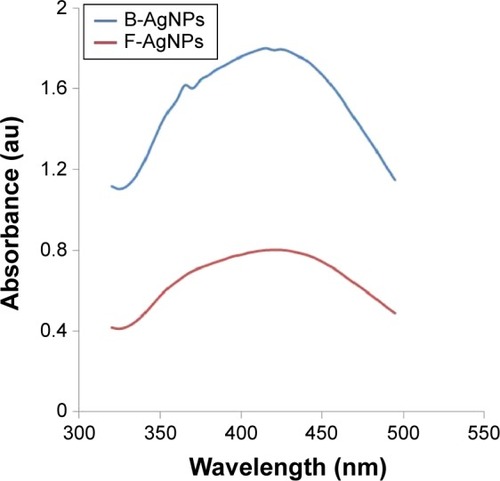
Figure 2 XRD pattern of B-AgNPs and F-AgNPs.
Notes: A representative XRD pattern of AgNPs formed after the reaction of culture supernatant of Bacillus tequilensis (A) and culture filtrate of milky mushroom (B) with 5 mM AgNO3 for 1 hour at 60°C. The XRD pattern shows two intense peaks in the entire spectrum of 2θ values ranging from 20°–80°. The intense peaks were observed at 2θ values of 31.9° and 45.9°, corresponding to the (111) and (200) planes for silver, respectively. The * denotes the additional as-yet-unassigned peaks that were observed in the F-AgNPs.
Abbreviations: AgNPs, silver nanoparticles; B-AgNPs, bacterium-derived AgNPs; F-AgNPs, fungus-derived AgNPs; XRD, X-ray diffraction.
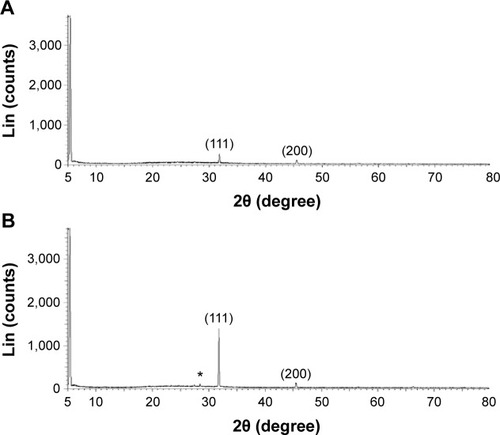
Figure 3 FTIR spectra of AgNPs synthesized by treating AgNO3 with culture supernatant of Bacillus tequilensis (A) and culture filtrate of milky mushroom (B).
Abbreviations: AgNPs, silver nanoparticles; FTIR, Fourier transform infrared.
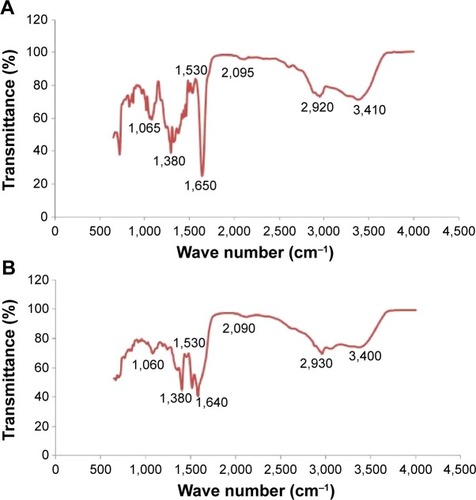
Figure 4 Size distribution analysis by DLS.
Notes: AgNPs were dispersed in deionized water, DMEM, and DMEM media with 10% fetal bovine serum and the particles were mixed thoroughly via sonication and vortexing. Samples were measured at 25 μg/mL.
Abbreviations: AgNPs, silver nanoparticles; B-AgNPs, bacterium-derived AgNPs; F-AgNPs, fungus-derived AgNPs; DLS, dynamic light scattering; DMEM, Dulbecco’s Modified Eagle’s Medium.
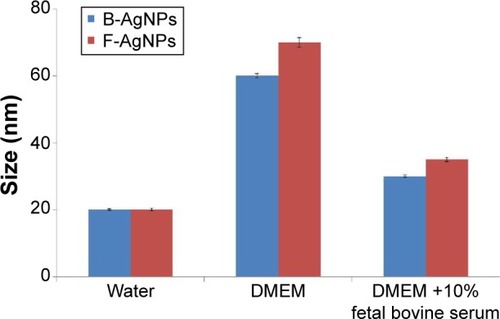
Figure 5 Size and surface morphology of B-AgNPs and F-AgNPs by TEM.
Notes: Several fields were photographed and used to determine the diameter of AgNPs using TEM. The average of observed diameters was 20 nm. TEM images of B-AgNPs (A) and F-AgNPs (B).
Abbreviations: AgNPs, silver nanoparticles; B-AgNPs, bacterium-derived AgNPs; F-AgNPs, fungus-derived AgNPs; TEM, transmission electron microscopy.
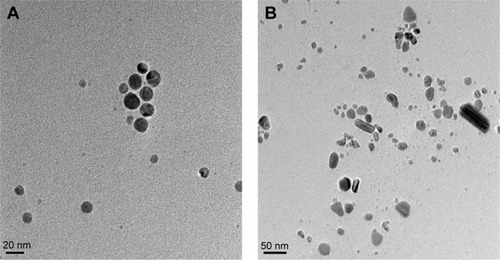
Figure 6 Effect of B-AgNPs and F-AgNPs on cell viability of MDA-MB-231 cells.
Notes: Cells were treated with various concentrations of B-AgNPs (A) and F-AgNPs (B) for 24 hours, and cytotoxicity was determined by the MTT method. The results are expressed as the mean ± SD of three independent experiments, each of which contained three replicates. Treated groups showed statistically significant differences from the control group by the Student’s t-test (P<0.05).
Abbreviations: B-AgNPs, bacterium-derived AgNPs; F-AgNPs, fungus-derived AgNPs; MTT, 3-[4,5-dimethylthiazol-2-yl]-2,5-diphenyltetrazolium bromide; SD, standard deviation.
![Figure 6 Effect of B-AgNPs and F-AgNPs on cell viability of MDA-MB-231 cells.Notes: Cells were treated with various concentrations of B-AgNPs (A) and F-AgNPs (B) for 24 hours, and cytotoxicity was determined by the MTT method. The results are expressed as the mean ± SD of three independent experiments, each of which contained three replicates. Treated groups showed statistically significant differences from the control group by the Student’s t-test (P<0.05).Abbreviations: B-AgNPs, bacterium-derived AgNPs; F-AgNPs, fungus-derived AgNPs; MTT, 3-[4,5-dimethylthiazol-2-yl]-2,5-diphenyltetrazolium bromide; SD, standard deviation.](/cms/asset/4f06c1af-adc2-44b3-8ba6-9bd187552f0f/dijn_a_83953_f0006_b.jpg)
Figure 7 Effect of B-AgNPs and F-AgNPs on membrane integrity of MDA-MB-231 cells.
Notes: The cells were treated with respective IC50 concentrations of B-AgNPs or F-AgNPs, and LDH leakage was measured by changes in optical density due to NAD+ reduction, monitored at 490 nm, as described in “Materials and methods”. The results are expressed as the mean ± SD of three independent experiments, each of which contained three replicates. Treated groups showed statistically significant differences from the control group by the Student’s t-test (P<0.05).
Abbreviations: B-AgNPs, bacterium-derived AgNPs; Con, control; DOX, doxorubicin; F-AgNPs, fungus-derived AgNPs; IC50, half-maximal inhibitory concentration; LDH, lactate dehydrogenase; NAD, nicotinamide adenine dinucleotide; SD, standard deviation.
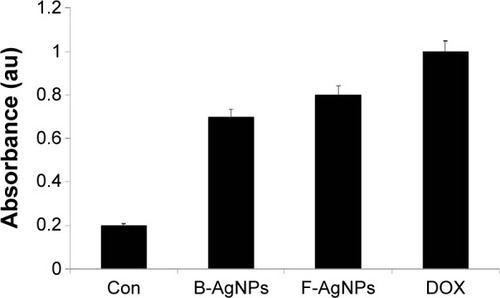
Figure 8 B-AgNPs and F-AgNPs induce ROS production in MDA-MB-231 cells.
Notes: Fluorescence images of MDA-MB-231 cells treated with respective IC50 concentrations of B-AgNPs or F-AgNPs incubated for 24 hours. The image shows significant formation of H2O2 inside the MDA-MB-231 cells, whereas no fluorescence was observed in control cells.
Abbreviations: B-AgNPs, bacterium-derived AgNPs; BF, bright field; DAPI, 4′,6-diamidino-2-phenylindole; DCF, 2′,7′-dichlorofluorescein; F-AgNPs, fungus-derived AgNPs; IC50, half-maximal inhibitory concentration; ROS, reactive oxygen species.
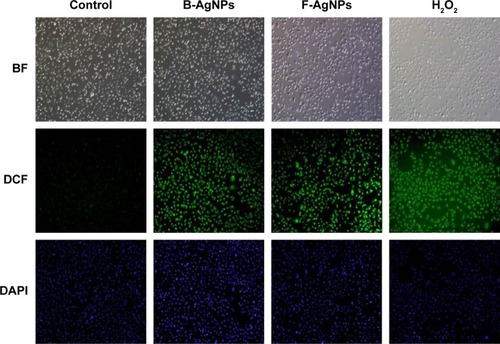
Figure 9 B-AgNPs and F-AgNPs promote apoptosis.
Notes: MDA-MB-231 cells were treated with respective IC50 concentrations of B-AgNPs or F-AgNPs for 24 hours. Fluorescent staining of cells was recorded. Representative images are shown for apoptotic DNA fragmentation (red staining) and corresponding nuclei (blue staining).
Abbreviations: B-AgNPs, bacterium-derived AgNPs; DAPI, 4′,6-diamidino-2-phenylindole; F-AgNPs, fungus-derived AgNPs; IC50, half-maximal inhibitory concentration; TUNEL, terminal deoxynucleotidyl transferase dUTP nick end labeling.
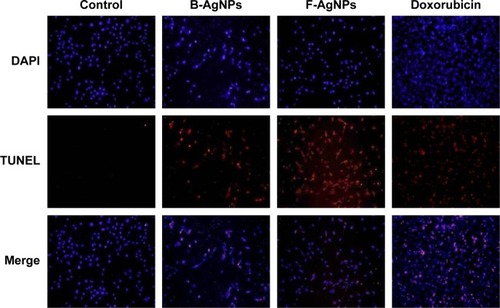
Figure 10 Western blot analysis of p-p53, p-Erk1/2, p-c-Jun, Bcl-2, procaspase-3, and actin expression in MDA-MB-231 cells exposed to B-AgNPs or F-AgNPs.
Notes: MDA-MB-231 cells were treated with respective IC50 concentrations of B-AgNPs or F-AgNPs for 24 hours. Expression of p-p53, p-Erk1/2, p-c-Jun, Bcl-2, and procaspase-3 protein levels were determined by Western blot analysis. Both B-AgNPs and F-AgNPs led to increased levels of p-p53, p-Erk1/2, and decreased levels of procaspase-3, whereas no alteration in expression was observed for p-c-Jun. Bcl-2 expressions significantly reduced. Equal protein loading was confirmed by analysis of β-actin protein levels. The results are representative of three independent experiments.
Abbreviations: B-AgNPs, bacterium-derived AgNPs; Con, control; F-AgNPs, fungus-derived AgNPs; IC50, half-maximal inhibitory concentration.
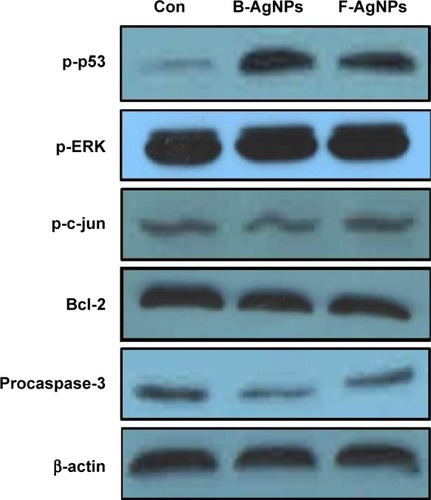
Figure 11 B-AgNPs and F-AgNPs induces caspase-3 activity in MDA-MB-231 cells.
Notes: MDA-MB-231 cells were treated with AgNPs and F-AgNPs with or without caspase-3 inhibitor Ac-DEVD-CHO for 24 hours. The concentration of p-nitroanilide released from the substrate was calculated from the absorbance at 405 nm. The results are expressed as the mean ± standard deviation of three independent experiments. The treated groups showed statistically significant differences from the control group by the Student’s t-test (P<0.05).
Abbreviations: B-AgNPs, bacterium-derived AgNPs; Con, control; F-AgNPs, fungus- derived AgNPs.
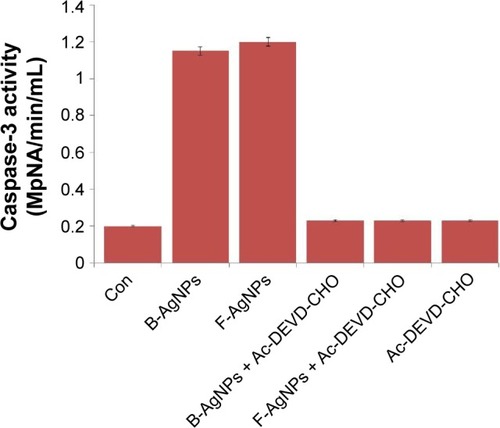
Figure 12 PFT-α inhibits B-AgNPs- and F-AgNPs-induced cell death in a p53-dependent manner.
Notes: Cells were pretreated with a p53 inhibitor (PFT-α, 10 μM) for 1 hour and then incubated with respective IC50 concentrations of B-AgNPs or F-AgNPs for 24 hours. Effects on cell viability (A) and protein expression of p-p53 (B) are shown as mean ± SD of three independent experiments. Lane 1 shows control; lane 2 shows B-AgNPs; lane 3 shows F-AgNPs; lane 4 shows B-AgNPs with PFT-α; and lane 5 shows F-AgNPs with PFT-α.
Abbreviations: B-AgNPs, bacterium-derived AgNPs; Con, control; F-AgNPs, fungus-derived AgNPs; IC50, half-maximal inhibitory concentration; PFT-α, pifithrin-alpha; SD, standard deviation.
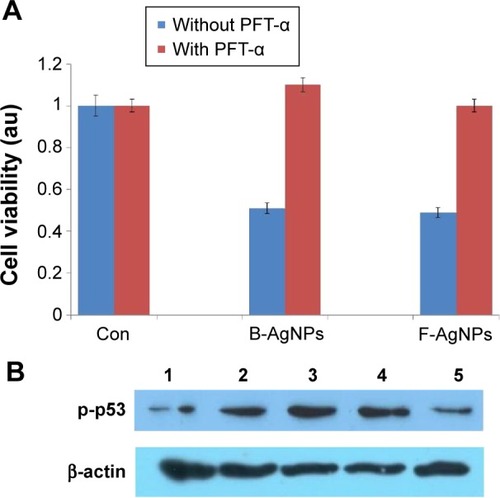
Figure 13 PFT-α inhibits B-AgNPs- and F-AgNPs-induced ROS generation in a p53-independent manner.
Notes: Cells were pretreated with PFT-α (10 μM) for 1 hour and then incubated with respective IC50 concentrations of B-AgNPs or F-AgNPs for 24 hours. The relative fluorescence of DCF was measured using a spectrofluorometer, with excitation at 480 nm and emission at 530 nm. All experiments were carried out in triplicate, and the experiments were repeated at least three times. Data are expressed as the mean relative gene expression ± SD of three independent determinations.
Abbreviations: B-AgNPs, bacterium-derived AgNPs; Con, control; DCF, 2′,7′-dichlorofluorescein; F-AgNPs, fungus-derived AgNPs; IC50, half-maximal inhibitory concentration; PFT-α, pifithrin-alpha; ROS, reactive oxygen species; SD, standard deviation.
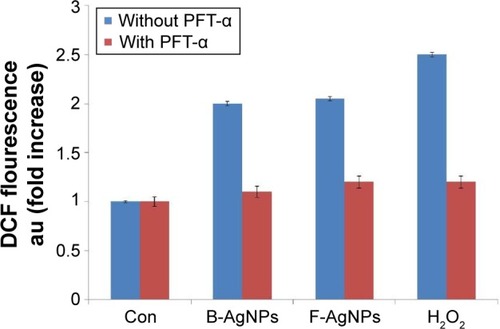
Figure 14 PFT-α inhibits B-AgNPs- and F-AgNPs-induced apoptosis in a p53-dependent manner.
Notes: Cells were pretreated with PFT-α (10 μM) for 1 hour and then incubated with respective IC50 concentrations of B-AgNPs or F-AgNPs for 24 hours. Apoptosis was measured using the TUNEL assay.
Abbreviations: B-AgNPs, bacterium-derived AgNPs; DAPI, 4′,6-diamidino-2-phenylindole; F-AgNPs, fungus-derived AgNPs; IC50, half-maximal inhibitory concentration; PFT- α, pifithrin-alpha; TUNEL, terminal deoxynucleotidyl transferase dUTP nick end labeling.
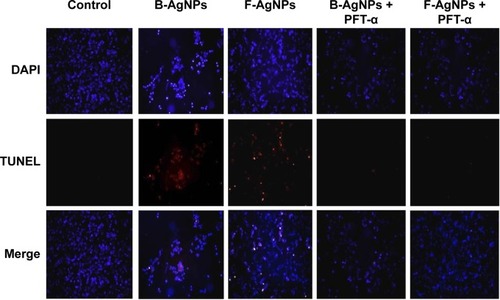
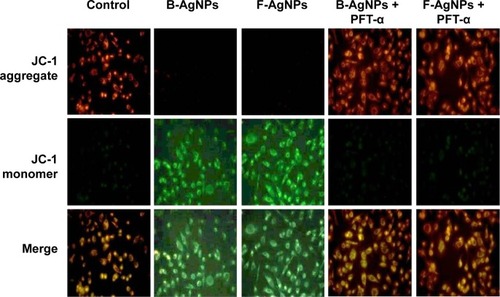
Figure 15 PFT-α inhibits B-AgNPs- and F-AgNPs-induced increase in MTP in a p53-independent manner.
Notes: Cells were pretreated with PFT-α (10 μM) for 1 hour and then incubated with respective IC50 concentrations of B-AgNPs or F-AgNPs for 24 hours. Changes in MTP were determined using the cationic fluorescent indicator JC-1. Fluorescence images of control and treated cells were recorded using fluorescence microscopy. JC-1 formed red fluorescent J-aggregates in healthy control cells with high MTP, whereas cells exposed to B-AgNPs or F-AgNPs had low MTP, and JC-1 existed as a monomer showing green fluorescence.
Abbreviations: B-AgNPs, bacterium-derived AgNPs; F-AgNPs, fungus-derived AgNPs; IC50, half-maximal inhibitory concentration; MTP, mitochondrial membrane potential; PFT-α, pifithrin-alpha.