Figures & data
Figure 1 Histological analysis and quantification of MWCNT aggregates in exposed mice.
Notes: Histological analysis of selected tissues from mice exposed to environmentally administered MWCNTs is shown. Dark deposits (arrowheads) corresponding to MWCNT aggregates were detectable. No dark deposits were observed in tissues from unexposed mice (ctrl); a full panel of representative tissues is shown. The scale bar for all photographs =100 µm.
Abbreviations: MWCNT, multi-wall carbon nanotube; ctrl, control; w, weeks.
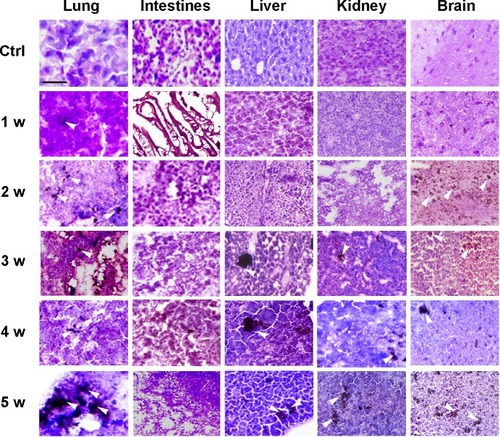
Figure 2 Quantification of the histological analysis of MWCNT aggregates in exposed mice.
Notes: MWCNTs in five random microscopic fields were counted in the lung, liver, brain, kidney, and intestine and provided with relative statistical analysis (*P<0.05, **P<0.01, ***P<0.001, ****P<0.0001, as assessed by two-tailed t-tests).
Abbreviation: MWCNT, multi-wall carbon nanotube.
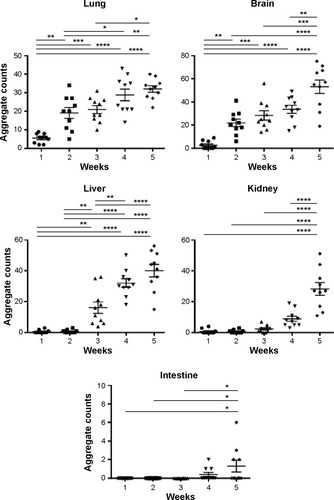
Figure 3 Ultrastructural analysis of MWCNT aggregates in selected organs.
Notes: TEM and SEM analyses of selected samples of murine tissues showed dark nanoparticle aggregates (arrowheads). Exposed lungs (A–C), liver (D–G), and brain (H–K) in TEM analysis presented dark needle-like structures (arrowheads) with dimensions similar to MWCNTs (A, B, D–F). SEM analysis of the KOH-resistant material confirmed the presence of MWCNTs in the lungs (C), liver (G), brain (K), and blood (L, M) of 5-week MWCNT-exposed animals. These structures were morphologically similar to MWCNT from stock material that has been characterized by SEM before (N) and after (O) KOH treatment, and were not found in unexposed animals. Combination of SEM analysis of MWCNT obtained by KOH corrosion of exposed liver (P) with EDAX (Q) clearly showed co-localization of carbon, indicating that the KOH-resistant material was MWCNT aggregates. Scale bars: (A) 4.5 µm; (B) 1 µm; (C) 1 µm; (D) 1 µm; (E) 1 µm; (F) 0.5 µm; (G) 1 µm; (H) 7.5 µm; (I) 2.7 µm; (J) 2 µm; (K) 0.75 µm; (L) 0.5 µm; (M) 0.1 µm; (N) 1 µm; (O) 1 µm.
Abbreviations: TEM, transmission electron microscopy; SEM, scanning electron microscopy; MWCNT, multi-wall carbon nanotubes; EDAX, energy dispersive X-ray analysis.
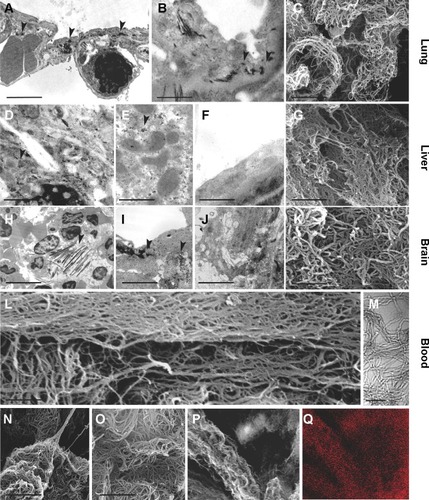
Figure 4 Detection of amyloid fibril deposits by Congo red and Thioflavin T staining.
Notes: In 5-week MWCNT-exposed mice, birefringence (arrowheads) following Congo red staining indicating amyloid deposition was found in the lung (C, D), liver (G, H), and brain (M, N), while these were not found in the same tissues from unexposed mice (A, B, E, F, K, L). In exposed liver (I, J) Thioflavin T revealed that amyloid fibrils are in association with venules (v) and biliary ducts (d). In the brain (O, P), the amyloid fibrils surround the MWCNT aggregates in what appears to be a nonself response. The scale bar for all photographs =200 µm.
Abbreviation: MWCNT, multi-wall carbon nanotube.
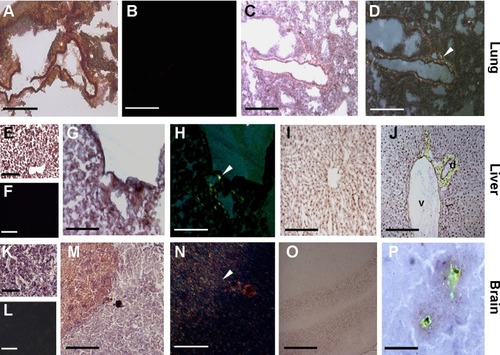
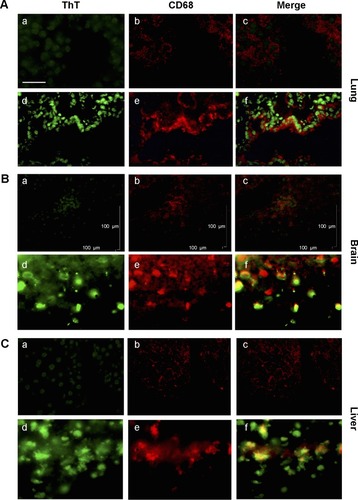
Figure 5 Association between amyloid fibril deposits and macrophage recruitment.
Notes: ThT and anti-CD68 antibody staining revealed co-localization between macrophages and amyloid fibril deposition. In the lung (A), brain (B), and the liver (C) from MWCNT-exposed mice, with respect to the controls (a–c), increased numbers of macrophages are evident in exposed animals (d–f), which are associated with areas of amyloid deposition. The scale bar for all photographs =100 µm.
Abbreviations: ThT, Thioflavin T; MWCNT, multi-wall carbon nanotube.