
Figures & data
Figure 1 Conjugation of CD133 antibodies with ultrasmall superparamagnetic iron oxides (USPIO-CD133 Ab).
Notes: (A) The distribution of USPIO and USPIO-CD133 Ab nanoparticles was observed by transmission electron microscopy. Bar, 100 nm. Spectrum histograms of the sizes of USPIO (B) and USPIO-CD133 Ab (C) are shown.
Abbreviations: USPIO, ultrasmall superparamagnetic iron oxide; USPIO-CD133 Ab, USPIO conjugated with anti-CD133 antibodies.
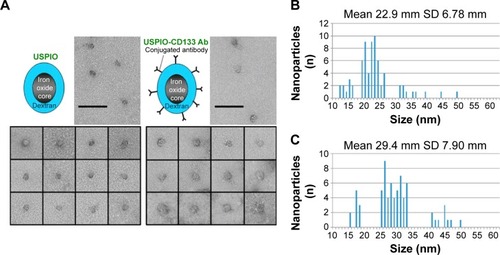
Figure 2 In vitro detection of USPIO-CD133 Ab binding to HT29 cells.
Notes: (A) The binding of USPIO-CD133 Ab was examined by Prussian blue staining in HT29 cells incubated with PBS (control), USPIO, and USPIO-CD133 Ab (Ai–Aiii). Smooth muscle cells with negative CD133 expression served as negative controls, and were incubated with PBS, USPIO, and USPIO-CD133 Ab (Aiv–Avi). Images were obtained under light-field microscope with 1,000× magnification. (B) In vitro MRI cell imaging of iron concentrations in standards and in USPIO-CD133 Ab-labeled cells. (Bi) Signals of T2-weighted fast spin echo (FSE) images from serial dilutions of a known concentration of SPIO (Resovist). (Bii) T2-weighted FSE images showing different concentrations (0 to 100 μg Fe/mL) of extracellular labeling after the incubation of USPIO-CD133 Ab with HT29 cells. Distilled water (DDW) or empty tube (AIR) served as references.
Abbreviations: MRI, magnetic resonance imaging; PBS, phosphate-buffered saline; SPIO, superparamagnetic iron oxide; USPIO, ultrasmall SPIO; USPIO-CD133 Ab, USPIO conjugated with anti-CD133 antibodies.
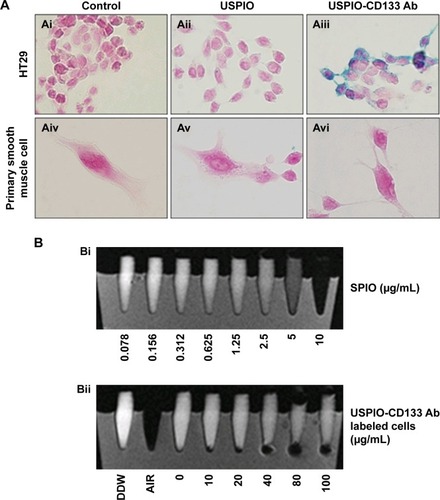
Figure 3 USPIO-CD133 Ab does not show in vitro cell toxicity.
Notes: (A) No significant difference in cells growth was detected between USPIO-CD133 Ab-labeled and unlabeled HT29 cells analyzed by MTS assay. (B) No apparent difference in cell apoptosis was found between USPIO-CD133 Ab-labeled and unlabeled HT29 cells analyzed by propidium iodide (PI) and Annexin V staining. The relative percentage of apoptosis was obtained by normalizing the mean of the apoptosis percentages in HT29 cells treated by H2O2 or USPIO-CD133 Ab relative to percentages in control cells. Bar, SE; ***P<0.001. (C) No significant difference in ROS production was observed between USPIO-CD133 Ab-labeled and unlabeled HT-29 cells analyzed by DCFDA staining. Detection of ROS in untreated HT-29 cells (Ci–Ciii); HT29 treated with H2O2 (Civ–Cvi); HT29 treated with USPIO-CD133 Ab at 20 μg/mL (Cvii–Cix); and HT29 treated with USPIO-CD133 Ab at 100 μg/mL (Cx–Cxii) using a fluorescent microscope (Ci, Civ, Cvii, Cx) and a flow cytometer (Ciii, Cvi, Cix and Cxii). DCF (fluorescence) is the end product after CM-H2DCFDA (no fluorescence) reacted with ROS.
Abbreviations: CM-H2DCFDA, 5-(and-6)-chloromethyl-2′,7′-dichlorodihydrofluorescein diacetate; DCF, dichlorohydrofluorescein; MTS, 3-(4,5-dimethylthiazol-2-yl)-5-(3-carboxymethoxyphenyl)-2-(4-sulfophenyl)-2H-tetrazolium; ROS, reactive oxygen species; SE, standard error of the mean; USPIO, ultrasmall superparamagnetic iron oxide; USPIO-CD133 Ab, USPIO conjugated with anti-CD133 antibodies.
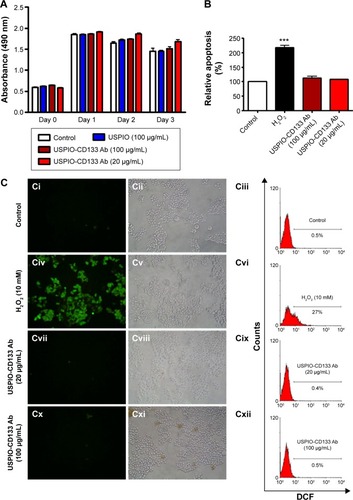
Figure 4 Detection of tumors by MRI in nude mice implanted with HT29 cells ex vivo labeled with USPIO-CD133 Ab.
Notes: (A) On day 14 after subcutaneous injection of HT29 cells without (Ai and Aii) or with ex vivo labeling of USPIO-CD133 Ab (Aiii and Aiv), xenografted tumors were noted at both flanks (arrows) and scanned by MRI for FSE T2-weighted (Ai and Aiii) and Merge (Aii and Aiv) images. (B) The representative signal ratio of tumor/muscle in MR images, including FSE T2-weighted (Bi) and Merge images (Bii). Bar, SE; *P<0.05.
Abbreviations: FSE, fast spin echo; MRI, magnetic resonance imgaing; Merge, multiple echo recombined gradient echo; SE, standard error of the mean; USPIO-CD133 Ab, ultrasmall superparamagnetic iron oxide conjugated with anti-CD133 antibodies.
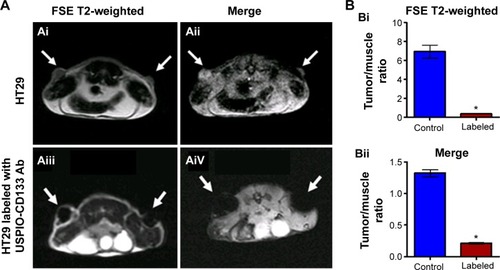
Figure 5 Detection of in vivo labeling by USPIO-CD133 Ab in CD133-positive subcutaneous xenografts by MRI.
Notes: (A) Photographs of CD133high and CD133low HT29 subcutaneous xenografts after subcutaneous inoculation of FACS-sorted CD133high and CD133low HT29 cells (Ai). H&E staining and differential CD133 immunostaining in CD133low (Aii and Aiv) and CD133high (Aiii and Av) xenografts at 400× magnification. (B) Gradient-echo (GRE) and multiple echo recombined gradient echo (Merge) images of CD133high and CD133low HT29 subcutaneous xenografts were acquired before (Bi and Biii, preinjection) and after (Bii and Biv, postinjection) intravenous injection of USPIO-CD133 Ab for 24 hours. (C) The representative signal drop ratio of MR images, including T2WI (Ci), multiecho GRE image (Cii), and Merge image (Ciii) after USPIO-CD133 Ab injection. Bar, SE; *P<0.05. (D) CD133 immunohistochemical analysis showed that the CD133high xenografts (Di) demonstrated stronger CD133 expression than the CD133low xenografts (Dii) at 400× magnification. When compared to CD133low xenografts (Diii), CD133high xenografts (Div) accumulated more iron as seen by Prussian blue staining at 1,000× magnification.
Abbreviations: FACS, fluorescence-activated cell sorting; GRE, gradient-echo; H&E, hematoxylin and eosin; Merge, multiple echo recombined gradient echo; MRI, magnetic resonance imaging; SE, standard error of the mean; T2WI, T2 weighted image; USPIO-CD133 Ab, ultrasmall superparamagnetic iron oxide conjugated with anti-CD133 antibodies.
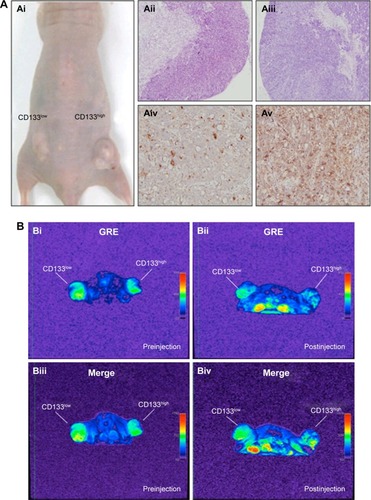
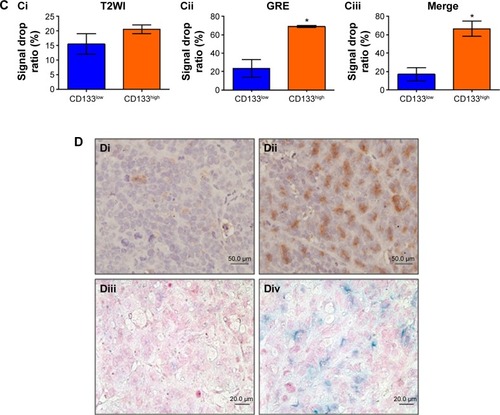
Figure 6 In vivo labeling of USPIO-CD133 Ab in ENU-induced rat brain tumors.
Notes: (A) Hypointensity of MRI signals after intravenous injection of USPIO-CD133 Ab. In T2 weighted images (Ai and Aiv), multiecho GRE images (Aii and Av), and Merge images (Aiii and Avi), MRI signals significantly decreased (white arrow) before (Ai–Aiii) and after (Aiv–Av) injection of USPIO-CD133 Ab for 24 hours. (B) USPIO-CD133 Ab decreased the signals of magnetic resonance (MR) imaging in ENU-induced rat brain tumors. (Bi) Gross view. (Bii) H&E staining at 100× magnification. (Biii) Multiple echo recombined gradient echo (Merge) image. (Biv) Prussian blue staining at 200× magnification in ENU-induced rat brain tumors. (C) The representative signal drop ratio of MR images, including T2WI (Ci), multiecho GRE images (Cii), and Merge images (Ciii) after USPIO-CD133 Ab injection. Bar, SE; *P<0.05.
Abbreviations: ENU, N-ethyl-N-nitrosourea; H&E, hematoxylin and eosin; GRE, gradient-echo; Merge, multiple echo recombined gradient echo; SE, standard error of the mean; T2WI, T2 weighted image; USPIO-CD133 Ab, ultrasmall superparamagnetic iron oxide conjugated with anti-CD133 antibodies.
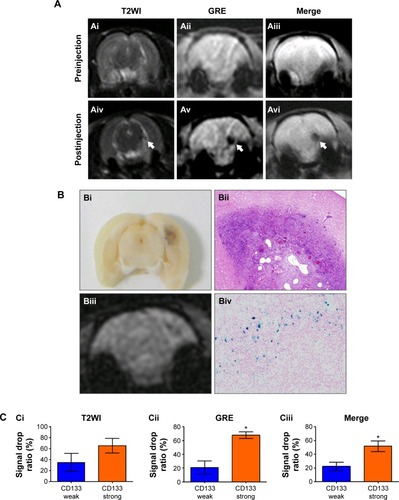
Figure 7 USPIO-CD133 Ab specifically targeted to ENU-induced rat brain tumor cells.
Notes: (A) Immunofluorescence staining of CD133 expression in microglia (CD68) and oligodendrocytes (oligodendrocyte-specific protein; [OSP]) of ENU-induced rat brain tumors was observed under fluorescent microscope at 200× (Ai and Aii) and 400× (Aiii and Aiv) magnification. (B) Detection of CD68 and CD133 expression in USPIO-CD133 Ab labeled cells of ENU-induced rat brain tumors. Double staining of CD133 (brown) and USPIO-CD133 Ab (Prussian blue staining) cells (indicated with arrows in Biv) are shown in the brain sections at 400× (Bi and Bii) and 1,000× (Biii and Biv) magnification.
Abbreviations: DAPI, 4′,6-diamidino-2-phenylindole; ENU, N-ethyl-N-nitrosourea; USPIO-CD133 Ab, ultrasmall superparamagnetic iron oxide conjugated with anti-CD133 antibodies.
![Figure 7 USPIO-CD133 Ab specifically targeted to ENU-induced rat brain tumor cells.Notes: (A) Immunofluorescence staining of CD133 expression in microglia (CD68) and oligodendrocytes (oligodendrocyte-specific protein; [OSP]) of ENU-induced rat brain tumors was observed under fluorescent microscope at 200× (Ai and Aii) and 400× (Aiii and Aiv) magnification. (B) Detection of CD68 and CD133 expression in USPIO-CD133 Ab labeled cells of ENU-induced rat brain tumors. Double staining of CD133 (brown) and USPIO-CD133 Ab (Prussian blue staining) cells (indicated with arrows in Biv) are shown in the brain sections at 400× (Bi and Bii) and 1,000× (Biii and Biv) magnification.Abbreviations: DAPI, 4′,6-diamidino-2-phenylindole; ENU, N-ethyl-N-nitrosourea; USPIO-CD133 Ab, ultrasmall superparamagnetic iron oxide conjugated with anti-CD133 antibodies.](/cms/asset/7588cc3f-9cd0-4bae-a90a-46d9ef12ac63/dijn_a_86592_f0007_c.jpg)
Figure S1 A high percentage of CD133-positive cells in HT29 cells.
Notes: (A) HT29 cells were stained with anti-CD133 antibody (green) and DAPI (blue) and observed under fluorescent microscope at 400× magnifications. (B) The percentage of CD133-positive HT29 cells was determined using flow cytometry. Using anti-CD133 Ab, the percentage of CD133-positive HT29 cells was analyzed from density plots (Bii). Isotype control antibodies served as a negative control (Bi).
Abbreviations: DAPI, 4′,6-diamidino-2-phenylindole; FITC, fluorescein isothiocyanate; FL, fluorescence; FSC, forward scatter; PE, phycoerythrin.
Figure S2 In vitro detection of USPIO-CD133 Ab binding to tumor cells using Prussian blue staining.
Notes: (A) Detection of CD133 expression in HT29, HepG2, and OC2 cells by Western blot. β-actin served as an internal control. (B) HT29, HepG2, and OC2 cells were incubated with PBS (Bi, Biv, and Bvii), USPIO (Bii, Bv, and Bviii), and USPIO-CD133 Ab (Biii, Bvi, and Bix), and the iron location detected by Prussian blue staining at 400× magnification.
Abbreviations: PBS, phosphate-buffered saline; USPIO, ultrasmall superparamagnetic iron oxide; USPIO-CD133 Ab, USPIO conjugated with anti-CD133 antibodies.
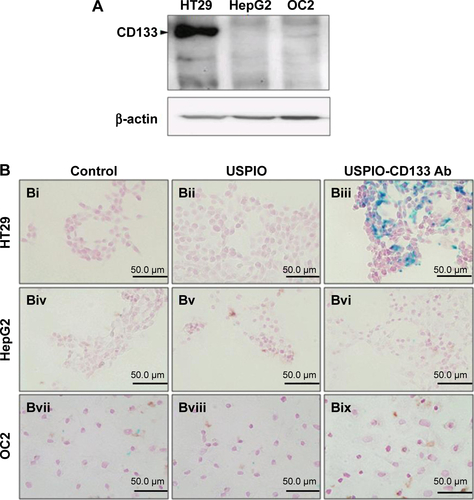
Figure S3 Effects of USPIO-CD133 Ab on cell growth of HepG2 and OC2 cells.
Notes: (A) No significant difference in cell growth was found between USPIO-CD133 Ab-labeled and unlabeled HepG2 analyzed by MTS assay. (B) No significant difference in cell growth was detected between USPIO-CD133 Ab-labeled and unlabeled OC2 cells analyzed by MTS assay.
Abbreviations: MTS, 3-(4,5-dimethylthiazol-2-yl)-5-(3-carboxymethoxyphenyl)-2-(4-sulfophenyl)-2H-tetrazolium; SPIO, superparamagnetic iron oxide; USPIO-CD133 Ab, ultrasmall SPIO conjugated with anti-CD133 antibodies.
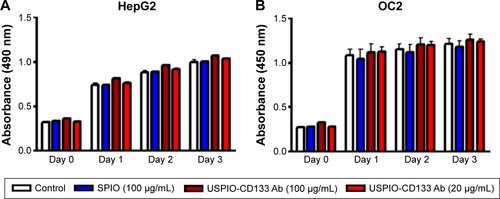
Figure S4 Cell apoptosis analysis of HT29 cells with different treatments by flow cytometry.
Notes: (A) Apoptosis analysis by detecting with Annexin V (FL2)/7-AAD (FL3) in HT29 cells without treatment (Ai); treated with H2O2 (Aii); labeled with 100 μg/mL of SPIO (Aiii); labeled with 100 μg/mL of USPIO (Aiv). (B) Apoptosis analysis by detecting with Annexin V (FL1)/PI (FL2) in HT29 cells without treatment (Bi); treated with H2O2 (Bii); labeled with 20 μg/mL of USPIO-CD133 Ab (Biii); labeled with 100 μg/mL of USPIO-CD133 Ab (Biv).
Abbreviations: 7-AAD, 7-aminoactinomycin D; FITC, fluorescein isothiocyanate; FL, fluorescence; PE, phycoerythrin; PI, propidium iodide; SPIO, superparamagnetic iron oxide; USPIO, ultrasmall SPIO; USPIO-CD133 Ab, USPIO conjugated with anti-CD133 antibodies.
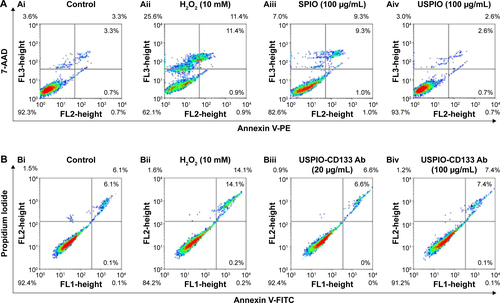
Figure S5 In vivo MR images of HT29 subcutaneous xenografts after intravenous injection of USPIO-CD133 Ab.
Notes: Photograph of tumor-bearing mouse (A); H&E staining of xenografted tumor at 100× magnification (B); FSE T2-weighted MR images of preinjection (C) and postinjection of USPIO-CD133 Ab for 24 hours (D).
Abbreviations: FSE, fast spin echo; H&E, hematoxylin and eosin; MR, magnetic resonance; USPIO, ultrasmall SPIO; USPIO-CD133 Ab, USPIO conjugated with anti-CD133 antibodies.
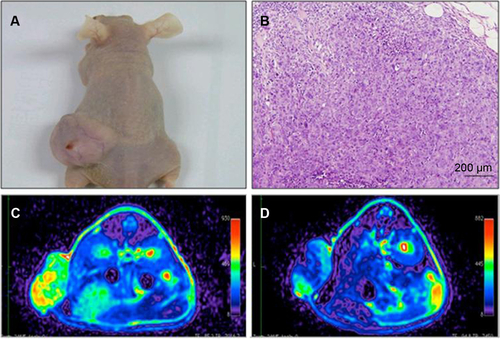
Figure S6 Gradient-echo (GRE) and multiple echo recombined gradient echo (Merge) images of HT29 and HepG2 subcutaneous xenografts were acquired after intravenous injection of USPIO-CD133 Ab for 48 hours. Liver tissues served as a reference for a positive control organ with marked signal drop.
Abbreviation: USPIO-CD133 Ab, ultrasmall superparamagnetic iron oxide conjugated with anti-CD133 antibodies.
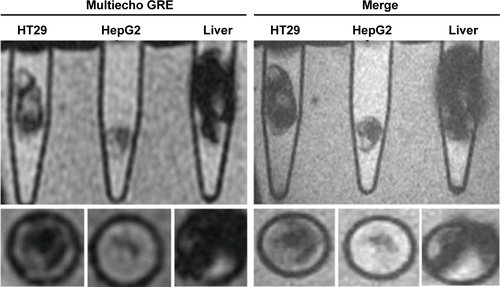
Figure S7 MR Images of ENU-induced rat brain tumor. Gross images of brain tumor specimens (top view [A] and sectioned view [B]); T1- and T2-weighted MR images show an intracranial mass with cystic necrosis (T1-weighted MR image [C] and T2-weighted MR image [D]); H&E staining (E) and CD133 immunostaining (F) at 400× magnification in rat brain tumor.
Abbreviations: H&E, hematoxylin and eosin; ENU, N-ethyl-N-nitrosourea; MR, magnetic resonance.
![Figure S7 MR Images of ENU-induced rat brain tumor. Gross images of brain tumor specimens (top view [A] and sectioned view [B]); T1- and T2-weighted MR images show an intracranial mass with cystic necrosis (T1-weighted MR image [C] and T2-weighted MR image [D]); H&E staining (E) and CD133 immunostaining (F) at 400× magnification in rat brain tumor.Abbreviations: H&E, hematoxylin and eosin; ENU, N-ethyl-N-nitrosourea; MR, magnetic resonance.](/cms/asset/d624402c-fd55-4fa1-8fe2-6cc8fadd76b8/dijn_a_86592_sf0007_c.jpg)