Figures & data
Figure 1 Schematic presentation of the formulas of the conjugates.
Notes: BC-PAMAM (a=10, b=9, c=0, d=0, e=13), FITC-BC-PAMAM (a=9, b=10, c=0, d=1, e=12), RR-PAMAM (a=0, b=0, c=1, d=0, e=31) and FITC-PAMAM (a=0, b=0, c=0, d=1, e=31). a – biotin, b – pyridoxal, c – Rhodamine Red™-X, d – fluorescein isothiocyanate (FITC).
Abbreviations: BC-PAMAM, biotin–polyamidoamine; FITC-BC-PAMAM, fluorescein isothiocyanate-labeled biotin–polyamidoamine bioconjugate.
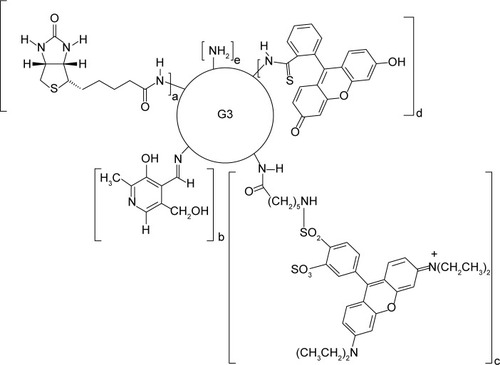
Figure 2 Concentration-dependent effects of PAMAM or BC-PAMAM treatment (24 hours) on the survival of normal human fibroblasts (BJ) and squamous carcinoma cells (SCC-15) measured with CyQUANT® NF dye.
Notes: Results (median of triplicate assays from four independent experiments) are expressed as a % of the nontreated controls. The whiskers are lower (25%) and upper (75%) quartile ranges. *P<0.05; Kruskal–Wallis test (against nontreated control), ▼P<0.05; Mann–Whitney U-test (PAMAM against BC-PAMAM).
Abbreviation: BC-PAMAM, biotin–polyamidoamine.
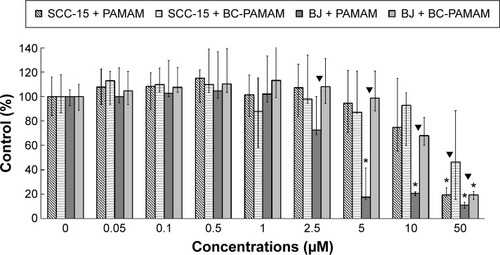
Figure 3 Confocal microscopy images of BJ and SCC-15 cell nuclei after 24 hours treatment with PAMAM or BC-PAMAM at concentrations from 2.5 µM to 50 µM or without dendrimers (control).
Notes: After treatment, the cells were incubated 2 days or 5 days in medium (BJ or SCC-15, respectively) and stained with CyQUANT® NF Cell Proliferation Assay Kit.
Abbreviations: BC-PAMAM, biotin–polyamidoamine; PAMAM, polyamidoamine.
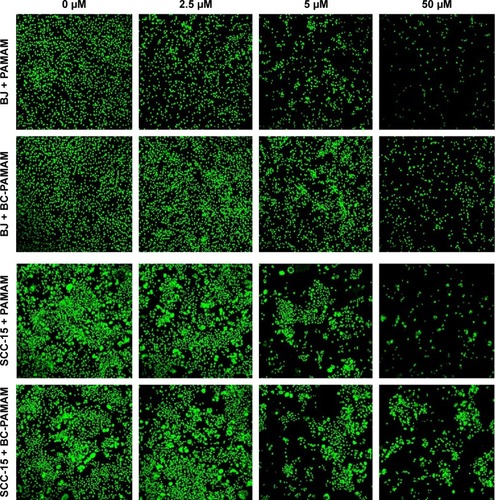
Figure 4 The total fluorescent intensity of the FITC-labeled PAMAM and BC-PAMAM in SCC-15 and BJ cells as a function of dendrimer concentration.
Notes: Cells were incubated with FITC-labeled dendrimers at various concentrations for 24 hours. Results are presented as median of triplicate assays from four independent experiments and whiskers are lower (25%) and upper (75%) quartile ranges. ▼P<0.05; Mann–Whitney U-test (PAMAM against BC-PAMAM).
Abbreviations: FITC-BC-PAMAM, fluorescein isothiocyanate-labeled biotin–polyamidoamine bioconjugate; BC-PAMAM, biotin–polyamidoamine.
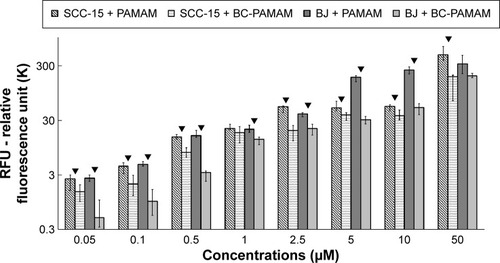
Figure 5 Intracellular colocalization of RR-PAMAM (red) and FITC-BC-PAMAM (green) in BJ and SCC-15 cells after 24 hours incubation with dendrimers at various concentrations (1–50 µM).
Notes: Colocalization is shown as a yellow signal. Cell imaging was performed on a Carl Zeiss Axio Observer Z1 LSM 710 inverted confocal microscope equipped with a 63× oil immersion objective.
Abbreviations: RR-PAMAM, Rhodamine Red™-X-labeled PAMAM G3; FITC-BC-PAMAM, fluorescein isothiocyanate-labeled biotin–polyamidoamine bioconjugate.
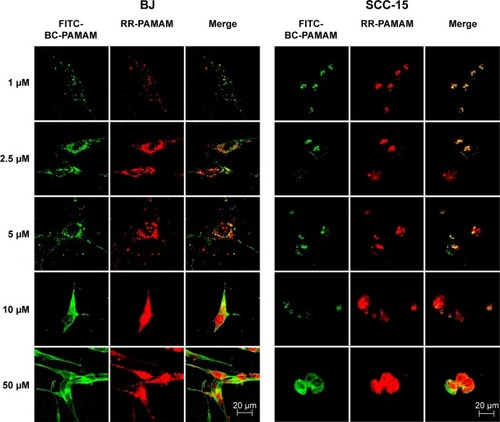
Table 1 Pearson’s coefficients and Mander’s coefficients (M1, M2) for RR-PAMAM colocalization with FITC-BC-PAMAM
Figure 6 Localization of FITC-BC-PAMAM (green) (A–C) and FITC-PAMAM (green) (D–F) in BJ cells.
Notes: Nuclei (blue) stained with DAPI. Images collected after 24 hours incubation at various concentrations of dendrimers.
Abbreviations: FITC-BC-PAMAM, fluorescein isothiocyanate-labeled biotin–polyamidoamine bioconjugate; DAPI, 4′,6-diamidino-2-phenylindole, dihydrochloride.
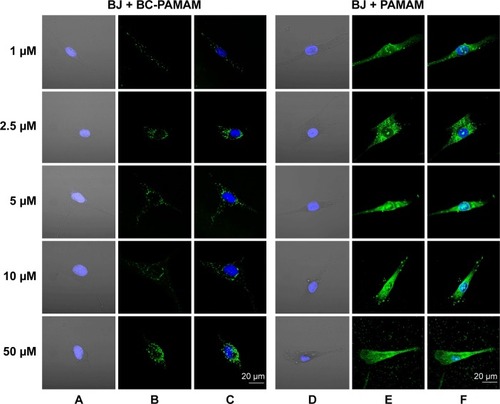
Figure 7 Localization of FITC-BC-PAMAM (green) (A–C) and FITC-PAMAM (green) (D–F) in SCC-15 cells.
Notes: Nuclei (blue) stained with DAPI. Images collected after 24 hours incubation with various concentrations of dendrimers.
Abbreviations: FITC-BC-PAMAM, fluorescein isothiocyanate-labeled biotin–polyamidoamine bioconjugate; DAPI, 4′,6-diamidino-2-phenylindole, dihydrochloride.
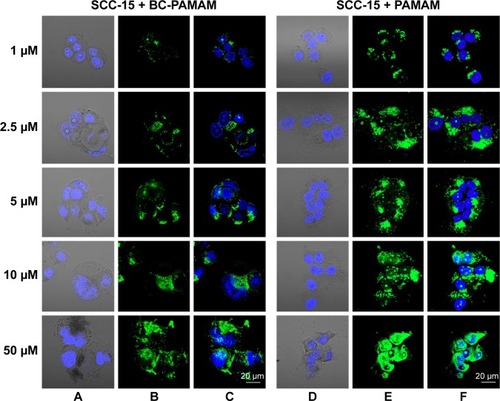
Figure 8 Ratio of the fraction of nuclear area occupied by the dendrimers (FITC-PAMAM or FITC-BC-PAMAM) to the total nuclear area (%) in BJ and SCC-15 cells after 24 hours treatment with various concentrations of dendrimers.
Notes: Results are the median of triplicates of four independent experiments, whiskers are lower (25%) and upper (75%) quartile ranges. ▼P<0.05; Mann–Whitney U-test (PAMAM against BC-PAMAM).
Abbreviation: FITC-BC-PAMAM, fluorescein isothiocyanate-labeled biotin–polyamidoamine bioconjugate.
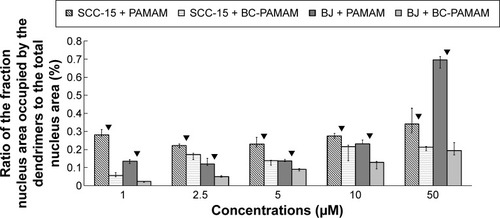
Figure 9 FITC-PAMAM or FITC-BC-PAMAM (green) colocalization with mitochondria (red) in (A) fibroblasts and (B) squamous cell carcinoma after 24 hours incubation with dendrimers (1–50 µM).
Notes: Mitochondria (red) were stained with MitoTracker® Deep Red FM and nuclei were stained with DAPI (blue). Colocalization is shown as a yellow signal. Cell imaging was performed on a Carl Zeiss Axio Observer Z1 LSM 710 inverted confocal microscope equipped with a 40× oil immersion objective.
Abbreviations: FITC-BC-PAMAM, fluorescein isothiocyanate-labeled biotin–polyamidoamine bioconjugate; DAPI, 4′,6-diamidino-2-phenylindole, dihydrochloride.
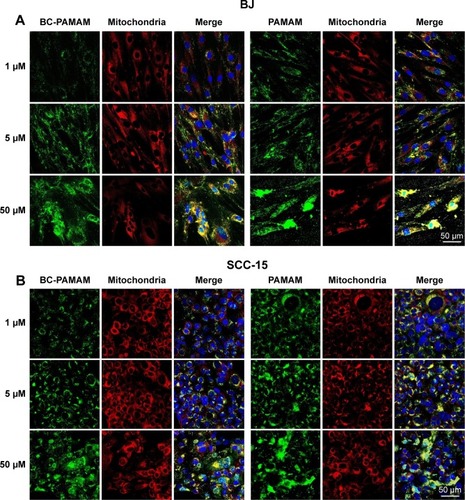
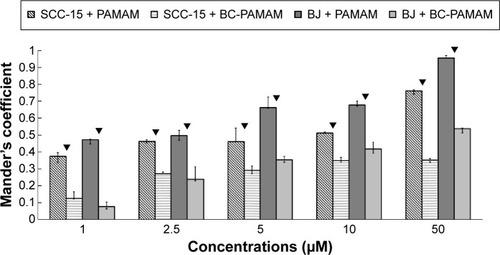
Figure 10 Mitochondrial localization of native FITC-PAMAM or FITC-BC-PAMAM expressed as Mander’s coefficient M2 (fraction of mitochondrial signal overlapping dendrimers) in BJ and SCC-15 cells after 24 hours dendrimer treatment (1–50 µM).
Notes: Results are the median of triplicates of four independent experiments, whiskers are lower (25%) and upper (75%) quartile ranges. ▼P<0.05; Mann–Whitney U-test (PAMAM against BC-PAMAM).
Abbreviations: FITC-PAMAM, fluorescein isothiocyanate–polyamidoamine; FITC-BC-PAMAM, fluorescein isothiocyanate-labeled biotin–polyamidoamine bioconjugate.