Figures & data
Figure 1 Transmission electron microscopy images of Mn-doped ZnS QDs.
Note: Circles indicate Mn-doped ZnS QDs.
Abbreviation: QDs, quantum dots.
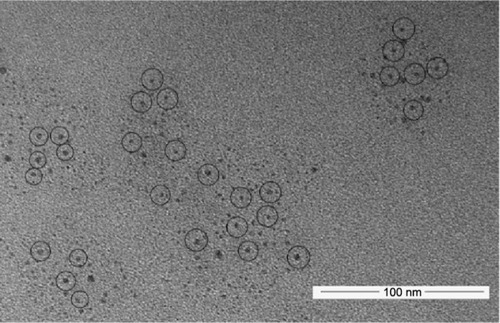
Figure 2 Characterization of Mn-doped ZnS QDs and Mn-doped ZnS QDs-PEG.
Notes: (A) UV-vis absorption, (B) PL spectra, and (C) XRD patterns of (a) Mn-doped ZnS QDs, (b) Mn-doped ZnS QDs-PEG, and (D) size distribution (DLS).
Abbreviations: DLS, dynamic light scattering; PEG, polyethylene glycol; PL, photoluminescence; QDs, quantum dots; UV-vis, ultraviolet-visible; XRD, X-ray powder diffraction.
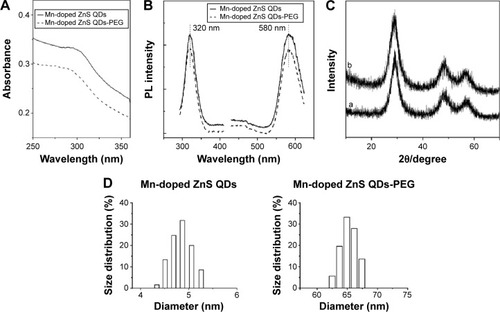
Figure 3 FTIR spectra of (a) Mn-doped ZnS QDs, (b) Mn-doped ZnS QDs-COOH, and (c) Mn-doped ZnS QDs-PEG.
Abbreviations: FTIR, Fourier transform infrared; PEG, polyethylene glycol; QDs, quantum dots.
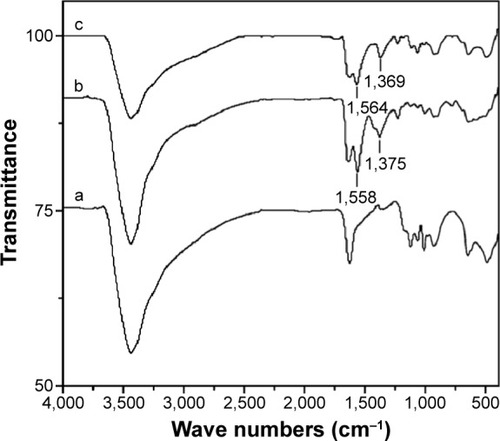
Table 1 Relative liver weight of mice at 24 hours and 28 days after consecutive intravenous injection of Mn-doped ZnS QDs and Mn-doped ZnS QDs-PEG
Figure 4 Body weight of mice after 7 days consecutive intravenous injection with Mn-doped ZnS QDs and Mn-doped ZnS QDs-PEG.
Notes: The “0” day was the day on which injection was completed. All data are presented as mean ± standard error of the mean (n=6).
Abbreviations: PEG, polyethylene glycol; QDs, quantum dots.
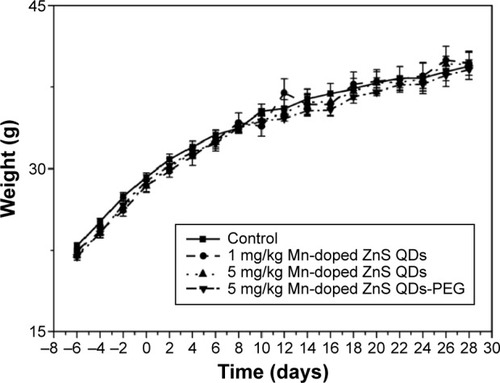
Figure 5 Serum aminotransferase levels after intravenous injection with Mn-doped ZnS QDs and Mn-doped ZnS QDs-PEG with different concentrations at 24 hours and 28 days.
Notes: (A) ALT and (B) AST. All data are presented as mean ± SEM (n=6).
Abbreviations: ALT, alanine aminotransferase; AST, aspartate aminotransferase; PEG, polyethylene glycol; QDs, quantum dots; SEM, standard error of the mean.
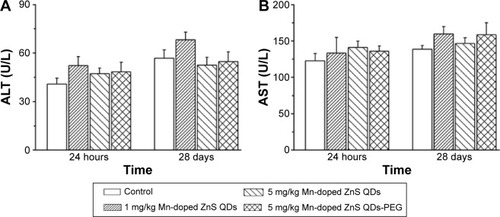
Figure 6 Levels of CAT, GSH-Px, and SOD in the liver of mice treated with Mn-doped ZnS QDs and Mn-doped ZnS QDs-PEG at time points of 24 hours (A–C) and 28 days (D–F).
Note: All data are presented as mean ± SEM (n=6).
Abbreviations: CAT, catalase; GSH-Px, glutathione peroxidase; PEG, polyethylene glycol; QDs, quantum dots; SEM, standard error of the mean; SOD, superoxide dismutase.
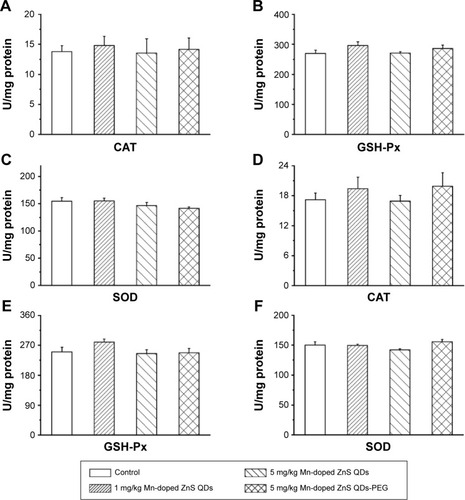
Figure 7 MDA levels in the liver of mice treated with Mn-doped ZnS QDs and Mn-doped ZnS QDs-PEG at 24 hours (A) and 28 days (B).
Note: All data are presented as mean ± SEM (n=6).
Abbreviations: MDA, malondialdehyde; PEG, polyethylene glycol; QDs, quantum dots; SEM, standard error of the mean.
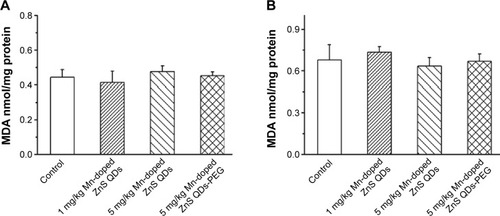
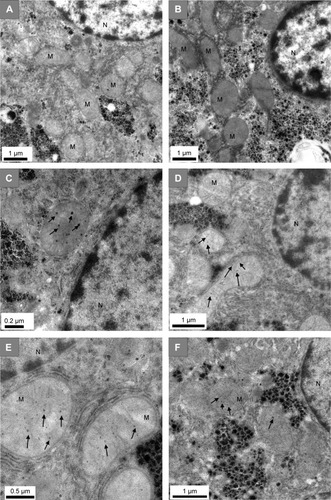
Figure 8 Ultrastructure of hepatocyte after treatment with control (A: 24 hours, B: 28 days), 5 mg/kg of Mn-doped ZnS QDs (C: 24 hours, D: 28 days), and Mn-doped ZnS QDs-PEG (E: 24 hours, F: 28 days).
Note: Arrows indicate Mn-doped ZnS QDs.
Abbreviations: PEG, polyethylene glycol; QDs, quantum dots; N, nucleus; M, mitochondria.