Figures & data
Figure 1 Electron micrograph of suspension of amorphous silica nanoparticles.
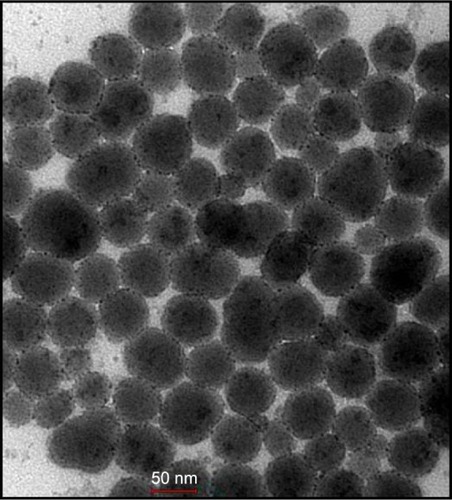
Figure 2 Circulating leukocyte numbers (A) and plasma activities of LDH (B) and CK (C) 24 hours after the administration of amorphous SiNPs (0.25 mg/kg) in mice (n=7–8).
Abbreviations: LDH, lactate dehydrogenase; CK, creatine kinase; SiNPs, silica nanoparticles.
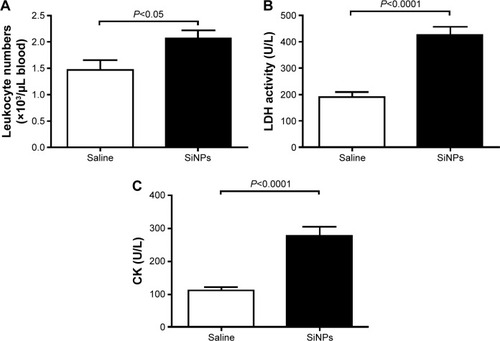
Figure 3 ALT (A) and AST (B) levels 24 hours after the administration of amorphous SiNPs (0.25 mg/kg) in mice (n=8).
Abbreviations: ALT, alanine aminotransferase; AST, aspartate aminotransferase; SiNPs, silica nanoparticles.
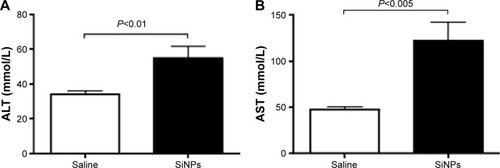
Table 1 Effect of amorphous SiNPs on concentrations of LPO and activities of SOD and CAT in various organs, including the lung, heart, liver, kidney, and brain
Table 2 Effect of amorphous SiNPs on concentrations of TNFα, IL-6, and IL-1β in various organs, including the lung, heart, liver, kidney, and brain
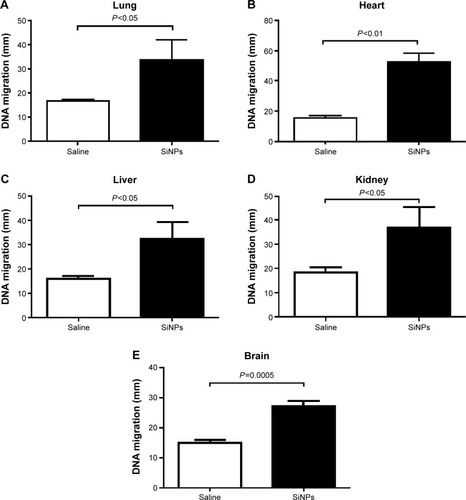
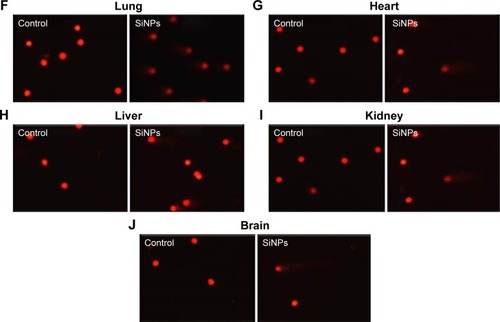
Figure 4 Effect of SiNPs on DNA migration in various organs.
Notes: DNA migration in the lung (A), heart (B), liver (C), kidney (D), and brain (E) tissues 24 hours after the administration of amorphous SiNPs (0.25 mg/kg) in mice. Data are mean ± SEM (n=5). Images illustrate the quantification of the DNA migration by the comet assay under alkaline conditions in the lung (F), heart (G), liver (H), kidney (I), and brain (J) tissues. The magnification in F–J is 20×.
Abbreviations: SiNPs, silica nanoparticles; SEM, standard error of the mean.