Figures & data
Figure 1 Particle size and size distribution of Gem-HSA-NP determined using a Malvern Zetasizer (A). Zeta potential spectrum of Gem-HSA-NP in PBS solution (B). TEM image of Gem-HSA-NP under ×20,000 magnification (C). TEM image of Gem-HSA-NP under ×50,000 magnification. The nanoparticles had a brighter core surrounded by a dark membrane (arrow), which confirmed its distinct layers (D).
Abbreviations: Gem-HSA-NP, gemcitabine-loaded human serum albumin nanoparticle; PBS, phosphate-buffered saline; TEM, transmission electron microscopy.
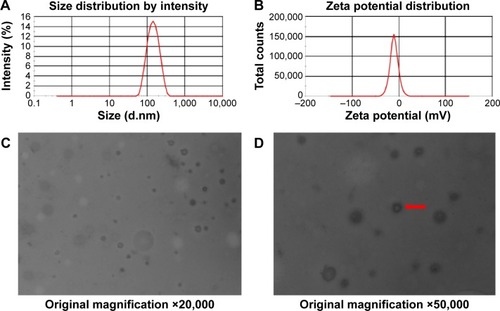
Figure 2 The cumulative release curve of Gem-HSA-NPs.
Notes: For the 1st hour, <20% of drugs were released and thereafter, the nanoparticles showed an accelerated release, whereas over half of Gem were released at the time of the 24th hour. For the 48th hour, >70% of Gem were released, followed by a slow sustained-release character. Until the 90th hour, a relative release peak of 81.5% was observed, and this remained stable for the next 30 hours.
Abbreviations: Gem-HSA-NP, gemcitabine-loaded human serum albumin nanoparticle; Gem, gemcitabine.
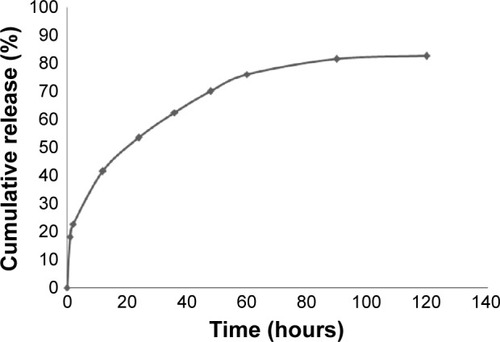
Figure 3 In vitro cytotoxicity assay of Gem-HSA-NP on BxPC-3 cell line.
Notes: The 1–8 surveying points stood for 0.01 μg/mL, 0.04 μg/mL, 0.2 μg/mL, 0.5 μg/mL, 1 μg/mL, 5 μg/mL, 10 μg/mL, and 50 μg/mL, respectively. All three drugs inhibited cell growth in a dose-dependent manner, in which Gem exhibited the highest cytotoxicity, followed by Gem-C14, whereas the Gem-HSA-NP showed the lowest cytotoxicity level. The IC50 of Gem is ~0.2 μg/mL, that of Gem-C14 is 0.35 μg/mL, and that of Gem-HSA-NPs is 0.4 μg/mL.
Abbreviations: Gem-HSA-NP, gemcitabine-loaded human serum albumin nanoparticle; Gem, gemcitabine; Gem-C14, 4-N-myristoyl-gemcitabine.
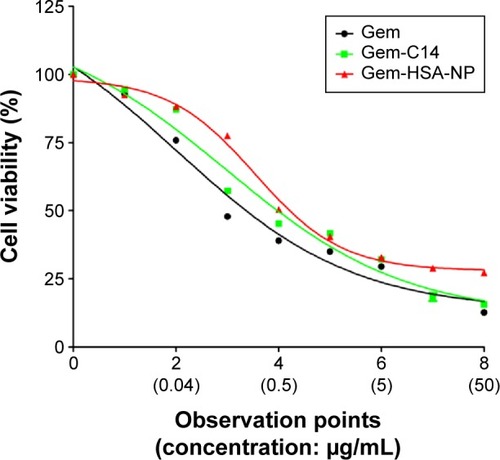
Figure 4 Annexin V-FITC/PI graphs of flow cytometry for Gem, Gem-C14, and Gem-HSA-NP.
Notes: The apoptotic rates of the three drugs were 34.94%±2.5%, 37.72%±1.8%, and 37.48%±2.6%, respectively. Numbers in the quadrants are percentage of cells in early apoptosis (UR), late apoptosis or necrosis (LR), and cell debris (UL).
Abbreviations: FITC, fluorescein isothiocyanate; Gem, gemcitabine; Gem-HSA-NP, gemcitabine-loaded human serum albumin nanoparticle; UR, upper right; LR, lower right; UL, upper left; PI, propidium iodide.
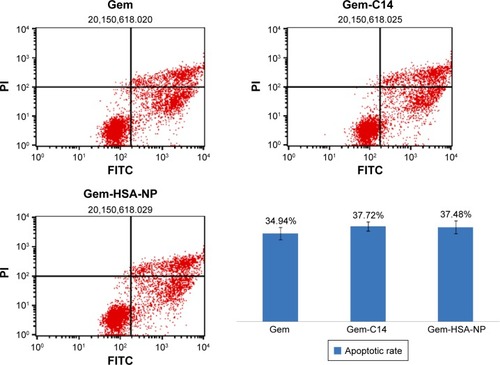
Figure 5 Representative photos of tumors on mice (A). Photographs of tumors harvested from each treatment group after various treatments (B). The tumor volume profiles of mice treated with Gem, Gem-C14, Gem-HSA-NP, and NS (C). The body weight profiles of mice treated with Gem, Gem-C14, Gem-HSA-NP, and NS (D).
Notes: 1–4 represent Gem, Gem-C14, Gem-HSA-NP, and NS group, respectively.
Abbreviations: Gem, gemcitabine; Gem-C14, 4-N-myristoyl-gemcitabine; Gem-HSA-NP, gemcitabine-loaded human serum albumin nanoparticle; NS, normal saline.
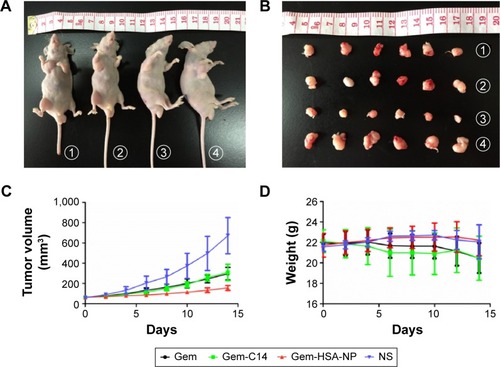
Figure 6 The merged TUNEL stainings showed tumor penetration of drugs on mice bearing subcutaneous pancreatic tumors on day 14 after IV administration.
Notes: Frozen sections were examined under a confocal microscope. Nuclei were stained with DAPI (blue), while red represented apoptotic cells. The bar indicated 50 μm.
Abbreviations: TUNEL, transferase dUTP nick end labeling; IV, intravenous; DAPI, 4′,6-diamidino-2-phenylindole; NC, negative control; Gem, gemcitabine; Gem-C14, 4-N-myristoyl-gemcitabine; Gem-HSA-NP, gemcitabine-loaded human serum albumin nanoparticle.
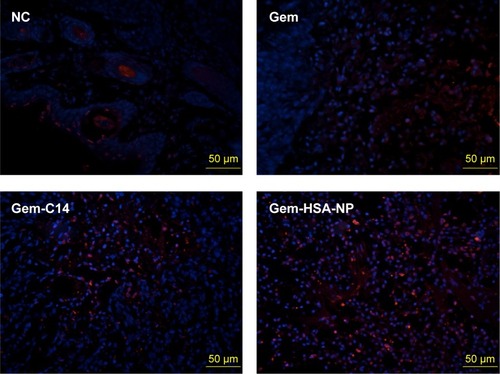
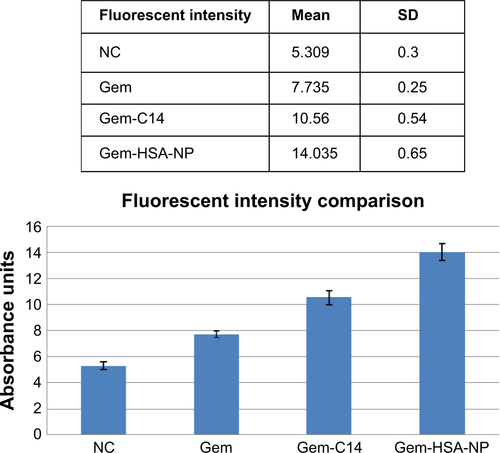
Figure S1 Comparison of the average fluorescent intensity in NC, Gem, Gem-C14, and Gem-HSA-NP groups.
Notes: Image J software was used to compare the average fluorescent intensity. Data showed a significant difference during the four groups (P<0.05).
Abbreviations: SD, standard deviation; NC, negative control; Gem, gemcitabine; Gem-C14, 4-N-myristoyl-gemcitabine; Gem-HSA-NP, gemcitabine-loaded human serum albumin nanoparticle.