Figures & data
Figure 1 Comparison between the X-ray beam spectra from a Papillon 50 system used for the treatment of colorectal cancer and the Therapax source used in this study.
Notes: (A) Papillon 50 X-ray beam spectra simulated with PENELOPE for the Papillon 50 geometry (green curve), simulated with Papillon 50 geometry including the CdTe detector geometry (red curve), and measured using CdTe detector (blue curve) (modified from Radiat Phys Chem, 81/6, Croce O, Hachem S, Franchisseur E, Marcie S, Gerard J, Bordy J, Contact radiotherapy using a 50 kV X-ray system: Evaluation of relative dose distribution with the Monte Carlo code PENELOPE and comparison with measurements., 609–617, Copyright (2012), with permission from Elsevier.Citation25). (B) Therapax SXT 150 X-ray beam spectra simulated with SpectrumGUI software and measured using CdTe detector for beam effective energies of 26 keV (modified from Lessard et al.Citation24).
Abbreviation: CdTe, cadmium telluride.
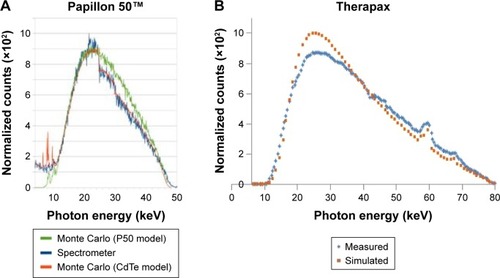
Figure 2 Characterization of Tio-GNPs.
Notes: (A) TEM image of Tio-GNPs (scale bar =20 nm). (B) Diameter distribution of Tio-GNPs measured using TEM. Magnification: 100,000×.
Abbreviations: TEM, transmission electron microscopy; Tio-GNPs, tiopronin-coated gold nanoparticles.
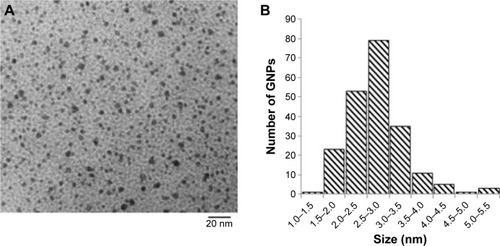
Figure 3 Subcellular localization and cellular uptake of Tio-GNPs.
Notes: (A) TEM image of subcellular localization of Tio-GNPs in HCT116 cells. Tio-GNPs in the cytoplasm were located in vesicles (black arrow). HCT-116 cells were incubated with 0.25 mg/mL of Tio-GNPs for 24 hours. Tio-GNPs were visualized using silver enhancement under TEM (scale bar =1 μm). (B) The uptake of GNPs in HCT116 cells after different times of incubation (0 hour, 4 hours, 8 hours, 24 hours, and 48 hours). HCT116 cells were incubated with 0.25 mg/mL of GNPs. Data are expressed as mean ± SEM. A significant increase in cellular uptake was measured compared to control, at 8 hours, 24 hours, and 48 hours after incubation (One-way ANOVA, 4 hours, P<0.01; 8 hours, P<0.001; 24 hours, P<0.01; 48 hours, P<0.05). No significant differences were found after 8 hours and 24 hours of incubation (P>0.05). Magnification: 3,500×.
Abbreviations: NS, not significant; SEM, standard error of the mean; TEM, transmission electron microscopy; Tio-GNPs, tiopronin-coated gold nanoparticles.
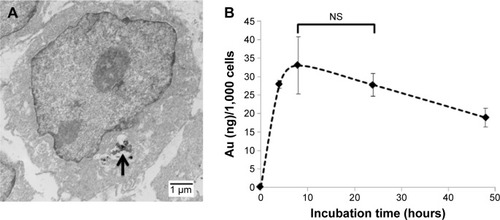
Figure 4 Survival curve of HCT116 cells treated with (■) radiation alone (SF = e(−0.217D−0.067D2), adjusted R2=0.9986, 50% cell survival, LD50 =1.98 Gy), (●) Tio-GNPs 0.1 mg/mL + radiation (SF = e(−0.669D−0.001D2), adjusted R2=0.9881, LD50 =1.03 Gy), and (□) Tio-GNPs 0.25 mg/mL + radiation (SF = e(−0.767D−0.022D2), adjusted R2=0.9943, LD50 =0.88 Gy).
Notes: Results are in response to a Two-way ANOVA. *Significant at P<0.05, **significant at P<0.01, ***significant at P<0.001, ****significant at P<0.0001.
Abbreviations: D, dose; NS, not significant; SF, survival fraction; Tio-GNPs, tiopronin-coated gold nanoparticles.
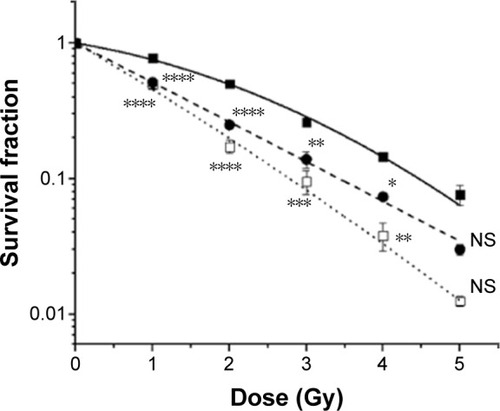
Figure 5 γH2A.X immunofluorescence study in HCT116 cells.
Notes: (A) γH2A.X immunofluorescence from DSBs induced by different treatments. (B) γH2A.X foci of control, Tio-GNPs alone, X-ray alone, and Tio-GNPs + X-ray. Two-way ANOVA was performed to analyze the difference between groups. Results are in response to a One-way ANOVA. ****Significant at P<0.0001.
Abbreviations: DSBs, double-strand breaks; NS, not significant; Tio-GNPs, tiopronin-coated gold nanoparticles.
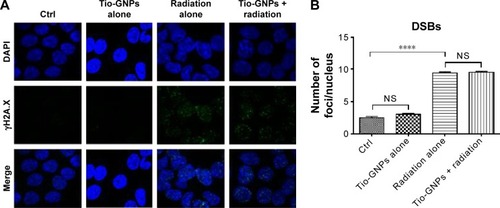
Figure 6 In vivo study of tumor growth delay after different treatments and tumor uptake of Tio-GNPs measured after IV or IT injection.
Notes: (A) The tumor growth delay after the initial treatment of nude mice bearing HCT116 colorectal tumor with IT PBS, IT Tio-GNPs, IT PBS plus radiation, IT Tio-GNPs plus radiation, and IV Tio-GNPs plus radiation. Tumor growth delay is reported as Vt/V0 ratio, where Vt is the mean tumor volume on a given day during the treatment and V0 is the mean tumor volume at the beginning of the treatment. Each symbol represents the mean ± SEM of the results obtained with at least five tumors. (B) Kaplan–Meier curve of mice whose tumors have reached the 4Td. An event is defined as the tumor size reached four times of its original size (4Td), (n=5) (C) Tumor uptake of Tio-GNPs at 8 hours after IT or IV after injecting 20 μL at a concentration of 36.63 mg/mL of Tio-GNPs/rat. Unpaired t-test was performed to analyze the difference between tumor uptake of Tio-GNPs by IT and IV injection. Results are in response to a log-rank test. *Significant at P<0.05, **Significant at P<0.01.
Abbreviations: IT, intra-tumoral; IV, intravenous; NS, not significant; PBS, phosphate-buffered saline; Tio-GNPs, tiopronin-coated gold nanoparticles; SEM, standard error of the mean.
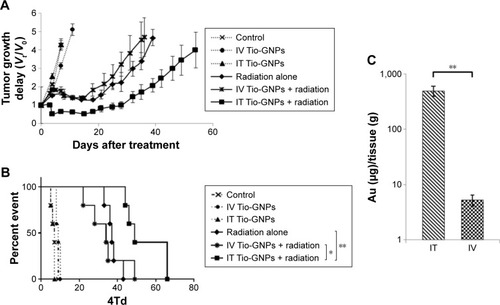
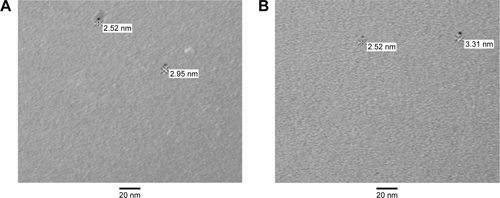
Figure S1 Tio-GNPs in MEM at concentrations of 0.1 mg/mL (A) and 0.25 mg/mL (B) without FBS were visualized under TEM.
Notes: Magnification of S1A and B: 100,000×.
Abbreviations: FBS, fetal bovine serum; MEM, minimum essential medium; TEM, transmission electron microscopy; Tio-GNPs, tiopronin-coated gold nanoparticles.