Figures & data
Table 1 The hydrodynamic size and zeta potential of the TNPs in ultrapure water and DMEM at different time points
Figure 1 Characterization of the TNPs.
Notes: (A) The TEM image showed TNPs appeared in the near-spherical particle shape and poorly dispersed. (B) The size distribution of the TNPs that was calculated by ImageJ software showed an approximately normal distribution. Data are expressed as mean ± SD; n=500 (scale bar: 100 nm).
Abbreviations: SD, standard deviation; TNPs, titanium dioxide nanoparticles; TEM, transmission electron microscope.
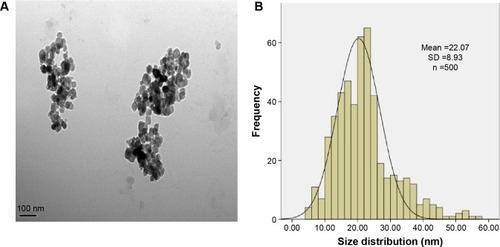
Figure 2 The TEM images of cellular uptake of BEAS-2B cells exposed to the TNPs (25 μg/mL) for 24 hours.
Notes: (A) Control group. (a) The magnification of selected area of control showed evidently intact mitochondrias (white arrows). (B) TNPs dispersed in cytoplasm either free or as membrane-bound aggregates. (b1) The TNPs deposited in mitochondria (white arrows); (b2) The TNPs localized in lysosomes (black arrows).
Abbreviations: TNPs, titanium dioxide nanoparticles; TEM, transmission electron microscope.
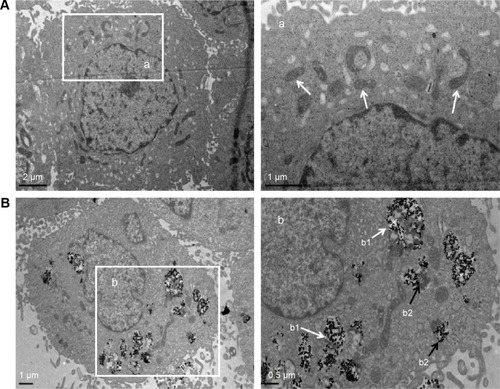
Figure 3 Cell viability of BEAS-2B cells exposed to TNPs for 24 hours induced by TNPs.
Notes: Cell viability of BEAS-2B cells was measured by an MTT assay after 24-hour exposure with various concentrations of TNPs. The results indicated that TNPs induced cytotoxicity in a dose-dependent manner. *P<0.05, compared with control. Data are expressed as mean ± SD; n=3.
Abbreviations: MTT, 3-(4,5-dimethyl-2-thiazolyl)-2,5-diphenyl-2-H-tetrazolium bromide; SD, standard deviation; TNPs, titanium dioxide nanoparticles.
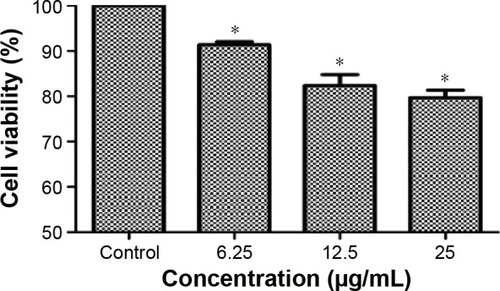
Figure 4 The autophagy induced by TNPs.
Notes: (A) Confocal microscopy images of MDC staining showed that the fluorescence intensity was increased in a dose-dependent manner. (B) Quantification of MDC staining by fluorescent intensity analysis. *P<0.05, compared with control. Data are expressed as mean ± SD; n=3 (scale bar: 25 μm).
Abbreviations: MDC, monodansylcadaverine; SD, standard deviation; TNPs, titanium dioxide nanoparticles.
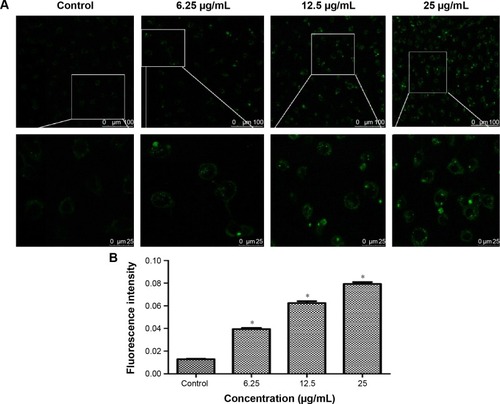
Figure 5 Autophagic ultrastructural analysis using TEM in BEAS-2B cells exposed to 25 μg/mL TNPs for 24 hours.
Notes: (A) Control cells showing typical distribution of organelles, (B) autophagic vacuoles containing cellular debris (arrows), (C) an autophagosome (arrow), (D, E) the fusion of autophagosomes with lysosomes (arrows), (F) late autophagic vacuoles contained partially degraded cytoplasmic materials (arrows).
Abbreviations: N, nucleus; TNPs, titanium dioxide nanoparticles; TEM, transmission electron microscope.
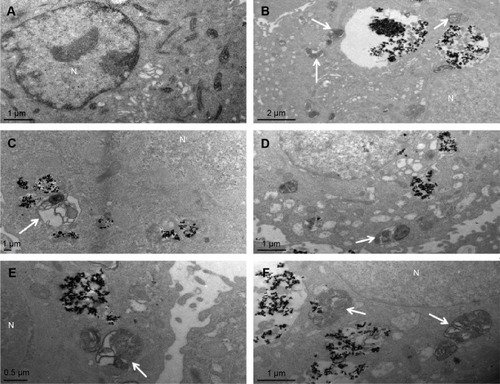
Figure 6 Detection and analysis of autophagy marker protein LC3.
Notes: Immunoblot of autophagy marker protein LC3. (A) The relative densitometric analysis of LC3. (B) The TNPs induced a dose-dependent conversion of LC3-I to LC3-II. *P<0.05, compared with control. Data are expressed as mean ± SD; n=3.
Abbreviations: SD, standard deviation; TNPs, titanium dioxide nanoparticles.
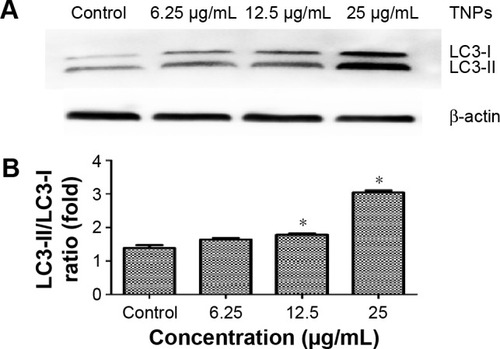
Figure 7 The expression of miR34a and Bcl-2 in BEAS-2B cells exposed to TNPs for 24 hours.
Notes: RNA was extracted and expression of gene was detected by real-time PCR. U6 and β-actin were utilized for an endogenous reference to standardize miRNA and mRNA expression levels. The protein level of Bcl-2 was measured by Western blot. TNPs downregulated the expression of miR34a (A) and the expression of Bcl-2 was decreased both in mRNA and protein levels (B–D) in a dose-dependent manner. *P<0.05, compared with control. Data are expressed as mean ± SD; n=3.
Abbreviations: Bcl-2, B-cell lymphoma/leukemia-2; miR34a, microRNA 34a; miRNA, microRNA; mRNA, messenger RNA; SD, standard deviation; TNPs, titanium dioxide nanoparticles.
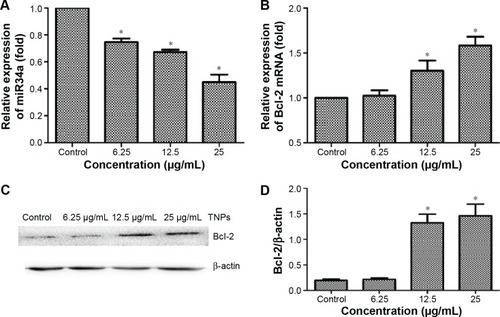
Figure 8 Overexpression of miR34a by lentivirus vector transfection.
Notes: BEAS-2B cells were transfected by lentivirus vectors with hsa-miR34a or empty lentiviral vectors for 72 hours. As shown in the pictures, the ratio of GFP expression was up to 80%, meaning that transfection efficiency was appropriate (A). We detected the expression of miR34a by real-time PCR, and the result showed that miR34a was successfully upregulated (B). *P<0.05, miR34a compared with miR-NC. Data are expressed as mean ± SD; n=3.
Abbreviations: GFP, green fluorescent protein; miR34a, microRNA 34a; miR-NC, microRNA negative control; SD, standard deviation.
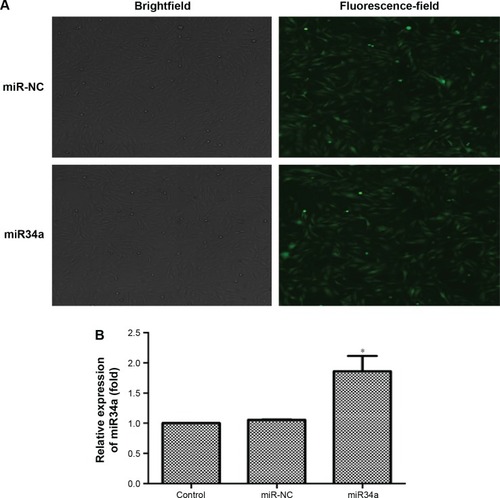
Figure 9 Effect of overexpressed miR34a on TNP-induced miR34a and Bcl-2 expression.
Notes: BEAS-2B cells were transfected by lentivirus vectors with miR34a or empty lentiviral vectors for 72 hours, the total RNAs were extracted from the transfected cells with or without treatment of TNPs (25 μg/mL) for 24 hours, and the expression of gene was detected by real-time PCR. (A) Overexpression of miR34a has attenuated the TNP-induced decrease of miR34a; (B–D) Overexpression of miR34a has attenuated the high levels of target Bcl-2 mRNA and protein in cells treated by TNPs. *P<0.05, TNPs compared with Control, #P<0.05, miR34a + TNPs compared with miR-NC + TNPs. Data are expressed as mean ± SD; n=3.
Abbreviations: Bcl-2, B-cell lymphoma/leukemia-2; miR34a, microRNA 34a; mRNA, messenger RNA; miR-NC, microRNA negative control; SD, standard deviation; TNPs, titanium dioxide nanoparticles.
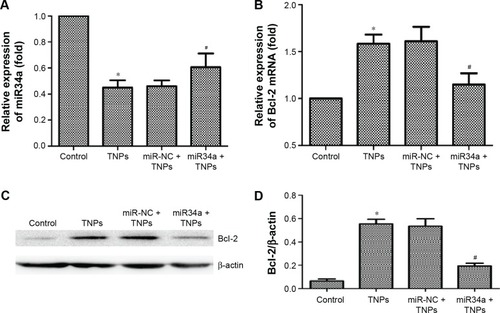
Figure 10 Effect of overexpressed miR34a on TNP-induced autophagy.
Notes: Immunoblot (A) and relative densitometric analysis (B) of autophagy marker protein LC3. Overexpression of miR34a accelerated the TNP-induced conversion of LC3-I to LC3-II significantly. *P<0.05, TNPs compared with Control, #P<0.05, miR34a + TNPs compared with miR-NC + TNPs. Data are expressed as mean ± SD; n=3.
Abbreviations: miR34a, microRNA 34a; miR-NC, microRNA negative control; SD, standard deviation; TNPs, titanium dioxide nanoparticles.
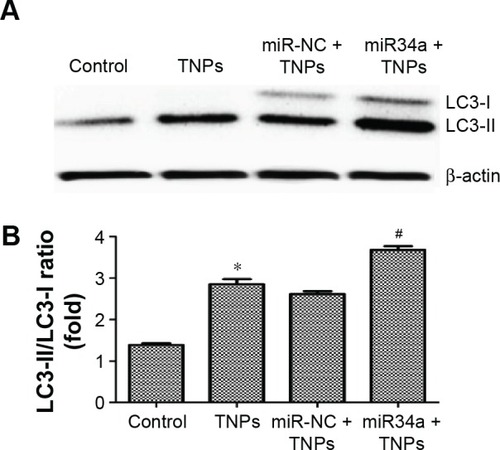
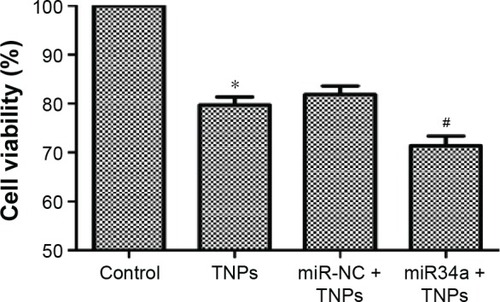
Figure 11 Effect of overexpressed miR34a on TNP-induced cell death.
Notes: After cells were transfected by lentivirus vectors, TNP of 25 μg/mL was added and incubated with cells for 24 hours. MTT assay was performed to measure the viability of cells. Data showed that overexpression of miR34a accelerated the TNP-induced cell death, leading to a lower viability of cells in miR34a + TNPs group. *P<0.05, TNPs compared with Control, #P<0.05, miR34a + TNPs compared with miR-NC + TNPs. Data are expressed as mean ± SD; n=3.
Abbreviations: MTT, 3-(4,5-dimethyl-2-thiazolyl)-2,5-diphenyl-2-H-tetrazolium bromide; miR34a, microRNA 34a; SD, standard deviation; miR-NC, microRNA negative control; TNPs, titanium dioxide nanoparticles.