Figures & data
Table 1 Characteristics of the Study Population
Table 2 49 Signals of the SNP-by-Sex Interactions with p-value Less Than 10−5 for Asthma
Figure 1 (A) Manhattan plot for the SNP-by-sex interaction GWAS. The X-axis indicates the chromosomal positions of each variant and the Y-axis shows the negative Log p-values. The blue horizontal line indicates the suggestive significance threshold (1x10⁻⁵),and the red horizontal line shows the genome-wide signficance threshold (5x10⁻⁸). (B) Quantile-Quantile plot showing the distribution of observed versus expected p-values. The genomic inflation factor, lambda (λ) = 1.025.
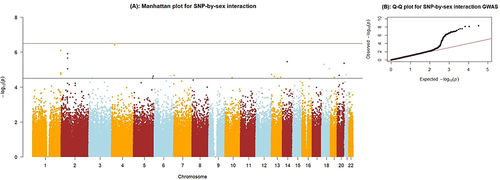
Table 3 Result of Sex Stratified Analysis for Asthma
Figure 2 Regional plots for the nine sex-specific SNPs show their respective locations. (A) SNP rs6701638 in KIF26B gene. (B) SNP rs17071077 near NMBR gene. (C) SNP rs254804 near PEPD gene. (D) SNP rs6013213 in NFATC2 gene. (E) SNP rs2968822 in RTN4 gene. (F) SNP rs2968801 near RTN4 gene. (G) SNP rs2864052 in RTN4 gene. (H) SNP rs9525931 near SERP2 gene. (I) SNP rs36213 in EPHB1 gene.
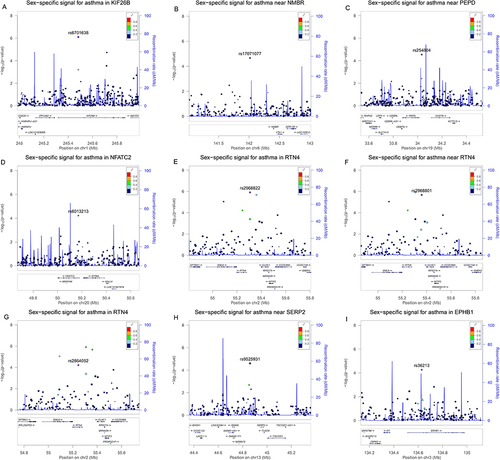
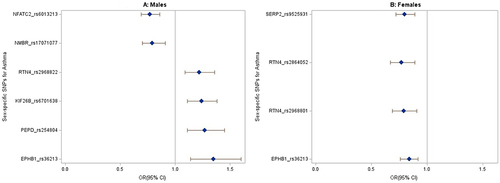
Figure 3 The forest plots show the odds ratio distribution for the sex-specific variants associated with asthma from the sex-stratified analysis. (A) Males. (B) Females. Only significant SNPs after Bonferroni adjustment were plotted. The blue diamonds represent effect sizes (Odds ratio), and the lines extending from the blue diamonds are the 95% confidence intervals.