
Figures & data
Figure 1 Cisplatin-induced growth inhibition and formation of DNA-adduct in APL cells.Citation14 APL cells (HL-60, NB4 and KG-1a) were exposed to various concentrations (0, 5, 10, 20, 40, and 80 μM) of cisplatin for 24 hours and further incubated for 24 hours with tritium labeled thymidine. After incubation, cells were harvested by centrifugation and counted using liquid scintillation analyzer. 3H-methyl thymidine incorporation was expressed as cpm/dish. Data represent the means of three independent experiments ± SDs. Highly statistically significant decreases (p < 0.01) in cell proliferation were observed in all cisplatin-treated APL cells including HL-60 (A), NB4 (B) and Kg-1a (C) cells. Cisplatin–induced formation of DNA adduct was assessed by immunocytochemistry and confocal microscopy analysis. APL cells were treated with various concentrations of cisplatin for 48 hours and immunocytochemistry as well as confocal microscopy using FITC filter were performed to confirm DNA adduct formation. The results showed that cisplatin caused a significant concentration-dependent increase in DNA-adduct formation in APL cells [D (i–vi)]. Multiple symbol indicators (*, **, #) indicate highly significant reductions (p<0.01) in growth between control and cisplatin-treated cells, respectively, for HL-60, NB4, and KG1a cells. Reproduced from Kumar S, Tchounwou PB. Molecular mechanisms of cisplatin cytotoxicity in acute promyelocytic leukemia cells. Oncotarget. 2015;6(38):40734–40746. Creative Commons license and disclaimer available from: http://creativecommons.org/licenses/by/4.0/legalcode.14
![Figure 1 Cisplatin-induced growth inhibition and formation of DNA-adduct in APL cells.Citation14 APL cells (HL-60, NB4 and KG-1a) were exposed to various concentrations (0, 5, 10, 20, 40, and 80 μM) of cisplatin for 24 hours and further incubated for 24 hours with tritium labeled thymidine. After incubation, cells were harvested by centrifugation and counted using liquid scintillation analyzer. 3H-methyl thymidine incorporation was expressed as cpm/dish. Data represent the means of three independent experiments ± SDs. Highly statistically significant decreases (p < 0.01) in cell proliferation were observed in all cisplatin-treated APL cells including HL-60 (A), NB4 (B) and Kg-1a (C) cells. Cisplatin–induced formation of DNA adduct was assessed by immunocytochemistry and confocal microscopy analysis. APL cells were treated with various concentrations of cisplatin for 48 hours and immunocytochemistry as well as confocal microscopy using FITC filter were performed to confirm DNA adduct formation. The results showed that cisplatin caused a significant concentration-dependent increase in DNA-adduct formation in APL cells [D (i–vi)]. Multiple symbol indicators (*, **, #) indicate highly significant reductions (p<0.01) in growth between control and cisplatin-treated cells, respectively, for HL-60, NB4, and KG1a cells. Reproduced from Kumar S, Tchounwou PB. Molecular mechanisms of cisplatin cytotoxicity in acute promyelocytic leukemia cells. Oncotarget. 2015;6(38):40734–40746. Creative Commons license and disclaimer available from: http://creativecommons.org/licenses/by/4.0/legalcode.14](/cms/asset/9e3b1250-9eb4-4416-8538-97148ad4539b/djep_a_12167354_f0001_c.jpg)
Figure 2 Cisplatin-induced cytotoxic effects in APL cells.Citation14 APL cells were exposed to various concentrations (0, 5, 10, 20, 40 and 80 μM) of cisplatin for 48 hours and LDH released in medium was measured using Promega non-radioactive cytotoxicity assay technical bulletin protocol. Then, % cytotoxicity was calculated by dividing the levels of released LDH in treated cells over the total LDH released from control cells. Highly statistically significant increases (p < 0.01) in cytotoxicity were observed in all cisplatin-treated APL cells including HL-60 (A), KG-1a (B) and NB4 (C) cells in a concentration-dependent fashion. Multiple symbol indicators (*, **, #) indicate highly significant increases (p<0.01) in cytotoxicity between control and cisplatin-treated cells, respectively, for HL-60, NB4, and KG1a cells. Reproduced from Kumar S, Tchounwou PB. Molecular mechanisms of cisplatin cytotoxicity in acute promyelocytic leukemia cells. Oncotarget. 2015;6(38):40734–40746. Creative Commons license and disclaimer available from: http://creativecommons.org/licenses/by/4.0/legalcode.14
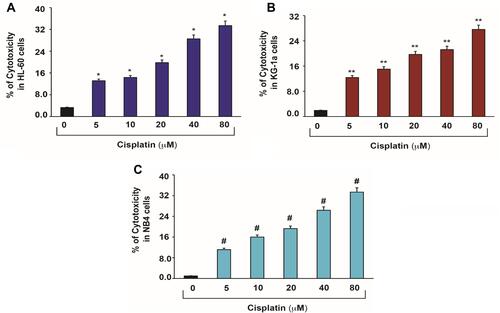
Figure 3 Cisplatin-induced oxidative stress and DNA damage in APL cells.Citation14 APL cells were exposed to various concentrations (0, 5, 10, 20, 40, and 80 μM) of cisplatin for 48 hours. ROS release was assessed by spectrofluorometry based on DCF fluorescence intensity after 30 min incubation with dichlorofluorescein diacetate (DCFDA). After incubation, ROS release was measured through measuring DCF fluorescence intensity by spectrofluorometry. Malondialdehyde (MDA) and GSH concentration levels were also measured by spectrophotometry. DNA damage was analyzed by both TUNEL and alkaline gel electrophoresis (Comet) assays. (A) ROS concentrations; (B) MDA concentrations; (C) GSH concentrations; (D) TUNEL assay images of DNA damage; (E) Comet assay images of DNA damage; (F) Percentages of DNA damage, and Comet tail lengths. Multiple symbol indicators (*, **, #, $) indicate highly significant increases (p<0.01) in ROS (*), MDA (**), DNA damage (*) and Comet tail length ($), and highly significant decreases (p<0.01) in GSH ($) between control and cisplatin-treated cells. Reproduced from Kumar S, Tchounwou PB. Molecular mechanisms of cisplatin cytotoxicity in acute promyelocytic leukemia cells. Oncotarget. 2015;6(38):40734–40746. Creative Commons license and disclaimer available from: http://creativecommons.org/licenses/by/4.0/legalcode.14
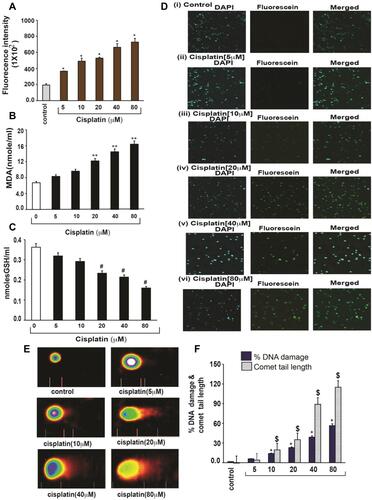
Figure 4 Chemical reactions showing hydrolysis of cisplatin. Reproduced with permission from Burda JV, Zeizinger M, Leszczynski J. Hydration process as an activation of trans- and cisplatin complexes in anticancer treatment. DFT and Ab initio computational study of thermodynamic and kinetic parameters. J Comput Chem. 2005;26(9):907–914. Copyright © 2005 Wiley Periodicals, Inc.Citation81
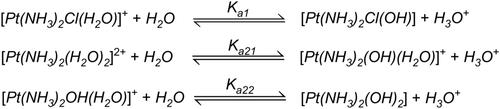
Figure 5 Molecular mechanisms of cisplatin-induced cytotoxicity in APL cells. Reproduced from Kumar S, Tchounwou PB. Molecular mechanisms of cisplatin cytotoxicity in acute promyelocytic leukemia cells. Oncotarget. 2015;6(38):40734–40746. Creative Commons license and disclaimer available from: http://creativecommons.org/licenses/by/4.0/legalcode.Citation14
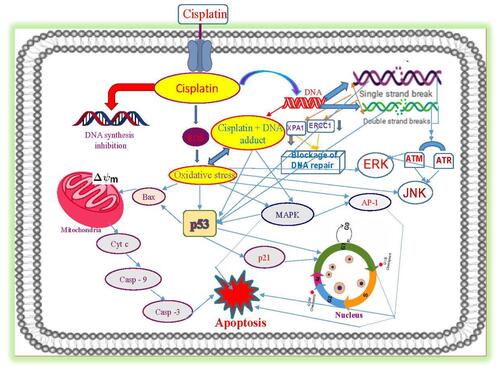
Table 1 Other Potential Cancer Drug Combinations with Cisplatin
Table 2 Natural Products Used in Reducing Cisplatin Toxicity and Suppressing Its Resistance
Table 3 Cisplatin-Nanoparticle Combinations Under Clinical Trials
Table 4 Nanoparticles Used in Combination with Cisplatin