
Figures & data
Figure 1 Biomarkers of type III collagen formation and cross-linking. (A) After pro-collagen triple helix folding (α1 chains), the N-and C-pro-peptides are cleaved in the extracellular space by the N-proteinase ADAMTS2 and the C-proteinase BMP-1. Type III collagen molecules are cross-linked by the enzymes lysyl oxidase (LOX), LOX-like (LOXL) 1–4 and transglutaminase 2 (TG2). (B) PRO-C3 measures type III collagen formation. PRO-C3 is based on a competitive ELISA that targets the ADAMTS2 cleavage site of the N-terminal pro-peptide and can measure single-and doublet stranded pro-peptides. PC3X measures type III collagen formation and cross-linking. PC3X is based on a sandwich ELISA that targets the same cleavage site as PRO-C3 but only measures cross-linked multimeric pro-peptides.
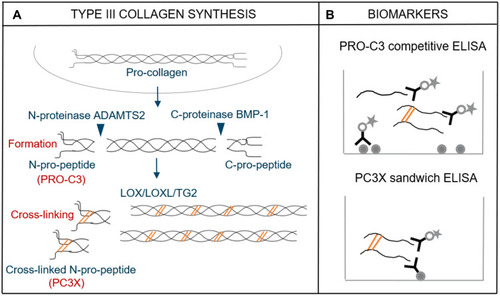
Table 1 Patient Characteristics: Liver Diseases and Healthy Controls
Figure 2 Evaluation of PC3X, PRO-C3 and AFP in healthy controls and in patients with non-cirrhotic HBV infection, cirrhosis and hepatocellular carcinoma (HCC). PC3X (A), PRO-C3 (B) and AFP levels (C) in healthy controls (n=44) and in patients with non-cirrhotic HBV infection (n=74), cirrhosis (n=86) and HCC (n=79). Data are presented as Tukey box plots. PC3X (D), PRO-C3 (E) and AFP (F) levels in cirrhosis and HCC patients separated by Child-Pugh score A (n=128), B (n=19) and C (n=9). The black horizontal lines represent the median value. Statistical differences were analyzed using the Kruskal–Wallis test adjusted for Dunn’s multiple comparisons test (A–F). *p<0.05, **p<0.01, ***p<0.001, ****p<0.0001.
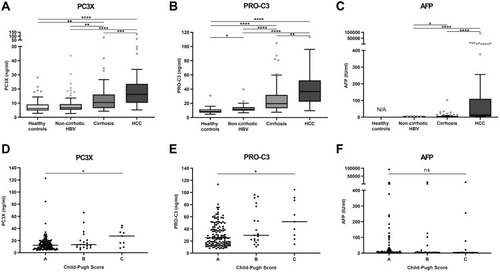
Figure 3 Correlation between PC3X and PRO-C3 levels. Pearson’s correlation analysis was performed to describe the relationship between PC3X and PRO-C3 levels in EDTA plasma from healthy controls and patients with non-cirrhotic HBV infection (A), and in cirrhosis and HCC patients (B).
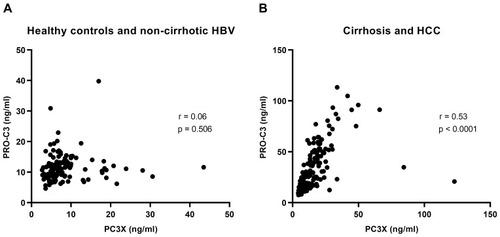
Table 2 Discriminative Performance of Biomarkers in HCC with BCLC 0/A Vs Cirrhosis
Figure 4 Kaplan–Meier analysis of progression-free survival and overall survival in hepatocellular carcinoma patients. Progression-free survival (A–C) and overall survival (D–F) for hepatocellular carcinoma patients with biomarker levels above the 75th percentile vs below for PC3X (A and D) and PRO-C3 (B and E), while for AFP it is above 20 Ul/mL vs below (C and F). A Log rank test was used to determine differences between the curves. A p-value of p<0.05 was considered significant.
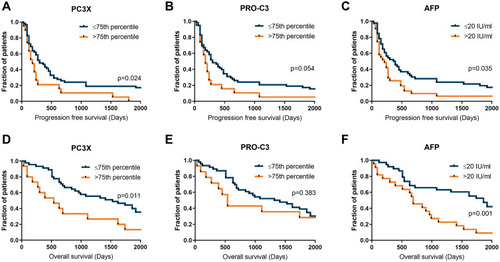
Figure 5 Progression-free survival and overall survival by Kaplan–Meier analysis, comparing the subgroups of patients with low or high PC3X and AFP levels in hepatocellular carcinoma. Progression-free survival (A) and overall survival (B) for hepatocellular carcinoma patients with either low PC3X and low AFP, high PC3X or high AFP, or high PC3X and high AFP. A Log rank test was used to determine differences between the curves. A p-value of p<0.05 was considered significant.
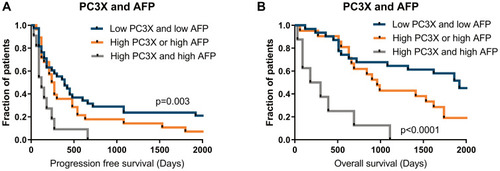
Table 3 Association Between Biomarker Levels, Clinical Covariates and Outcome for HCC Patients