Figures & data
Table 1 Demographic and Biochemical Characteristics of the Study Population
Figure 1 Markers of inflammation and indexes of visceral adiposity, insulin resistance and fatty liver are elevated in individuals with obesity and type 2 diabetes (T2D). Comparison of fasting serum concentrations of (A) serum amyloid A (SAA), (B) endotoxin, (C) osteopontin, (D) C-reactive protein (CRP), (E) visceral adiposity index (VAI), (F) triglycerides and glucose (TyG) index and (G) fatty liver index (FLI) in subjects with normal weight (NW), obesity and normoglycemia (OB-NG), and obesity and impaired glucose tolerance or T2D (OB-IGT&T2D). Bars represent the mean ± SD. Statistical differences between groups were analyzed by ANOVA followed by LSD tests. *P<0.05, **P<0.01 and ***P<0.001.
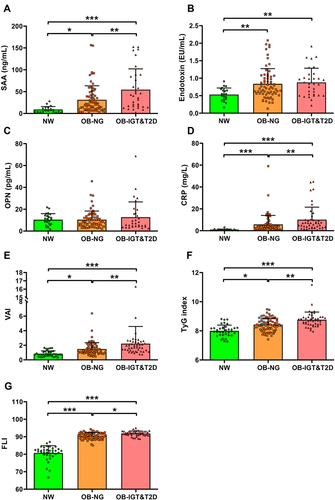
Figure 2 Serum concentrations of IL-1RA increases with obesity and glucose intolerance and are not altered by gender. (A) Fasting serum levels of IL-1RA in normal weight (NW) subjects and patients with obesity. (B) Effect of gender on serum IL-1RA levels. (C) Serum levels of IL-1RA in individuals with NW, obesity and normoglycemia (OB-NG), and obesity and impaired glucose tolerance or T2D (OB-IGT&T2D). Boxes represent first and third quartiles and median, with whiskers showing 10–90 percentile. Statistical differences between groups were analyzed by unpaired Student’s t test or ANOVA followed by LSD tests. ***P<0.001.
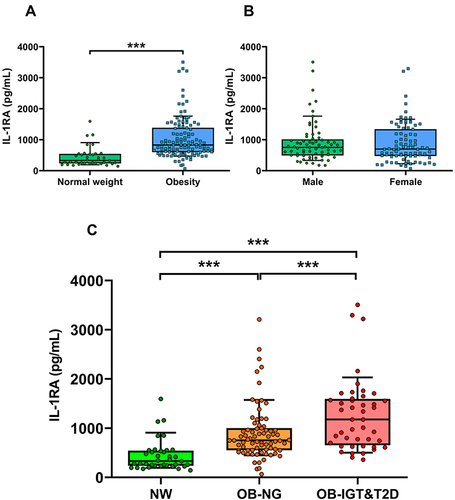
Figure 3 Serum IL-1RA correlates with leptin and adiponectin and with the marker of dysfunctional adipose tissue adiponectin/leptin (Adpn/Lep) ratio. Comparison of fasting serum concentrations of (A) leptin, (B) adiponectin, and (C) Adpn/Lep ratio in subjects with normal weight (NW), obesity and normoglycemia (OB-NG), and obesity and impaired glucose tolerance or T2D (OB-IGT&T2D). Bars represent the mean ± SD. Statistical differences between groups were analyzed by ANOVA followed by LSD tests. ***P<0.001. Scatter diagrams showing the correlations between the circulating concentrations of IL-1RA with the levels of (D) leptin, (E) adiponectin, and (F) the Adpn/Lep ratio. Pearson’s correlation coefficient (r) and P values are indicated. The y-axis is shown in log scale in (F) and horizontal discontinuous lines denote the Adpn/Lep ratio proposed cut-offs of 0.5 and 1.0.Citation50,Citation51
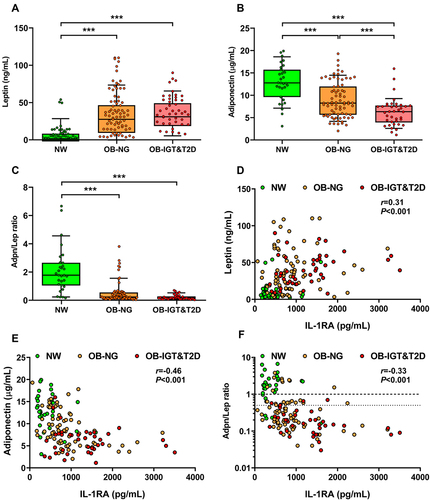
Figure 4 The expression of IL1RN in visceral adipose tissue (VAT) is increased in patients with obesity and impaired glucose (IGF) intolerance or type 2 diabetes (T2D). (A) Levels of IL1RN mRNA in VAT of subjects with normal weight (NW), obesity and normoglycemia (OB-NG), and obesity and IGT or T2D (OB-IGT&T2D). Bars represent the mean ± SD of the ratio between IL1RN to 18S rRNA. The expression of IL1RN in NW subjects was assumed to be 1. Differences between groups were analyzed ANOVA followed by LSD tests. **P<0.01. Scatter diagrams showing the correlations between IL1RN mRNA and the mRNA expression levels of (B) SPP1, (C) TNF, (D) CCL2, (E) CD68, (F) MMP9, and (G) VEGFA in VAT. Pearson’s correlation coefficient (r) and P values are indicated.
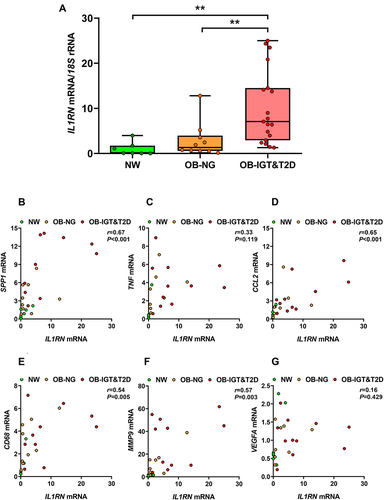
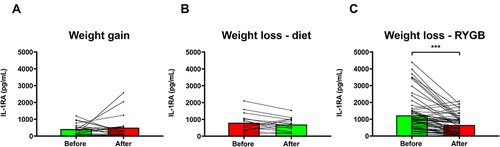
Figure 5 Serum IL-1RA levels are changed after bariatric surgery-induced weight loss (WL), but not after diet-induced WL or slight weight gain (WG). (A) Effect of WG on serum IL-1RA concentrations. (B) Effect of WL on serum IL-1RA levels in patients with obesity following a conventional dietary intervention. (C) Effect of WL on serum IL-1RA concentrations in patients with obesity undergoing Roux-en-Y gastric bypass (RYGB). Bars representing the mean and the pre- and post-intervention dots are shown. Differences between pre and post weight change were analyzed by paired two-tailed Student’s t tests. ***P<0.001.