Figures & data
Figure 1 Schematic diagram illustrating the structural differences between the typical ADAMs and ADAMDEC1. The structural composition of ADAMDEC1 consists of a signaling peptide, prodomain, metalloprotease and disintegrin-like domain. The third histidine (H) of the characteristic histidine repeat motif in the zinc-binding site is replaced by aspartate (D) within the metalloprotease domain of ADAMDEC1.
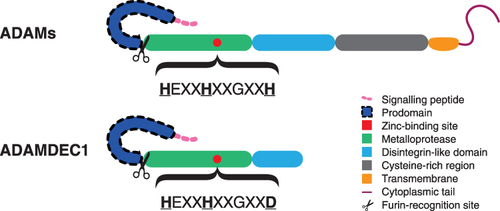
Figure 2 The zinc-binding motif in the metalloprotease catalytic site of ADAMDEC1 is highly conserved in mammals. The bold letters represent the histidine repeat motif in which the third histidine is replaced by aspartate in the zinc-binding site of ADAMDEC1. Only two and nine variations of amino acid exist at the two amino acid positions, shaded blue and red respectively, within the zinc-binding motif among the 126 species known to possess ADAMDEC1.
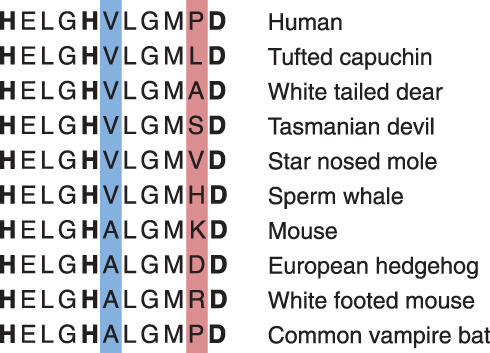
Figure 3 ADAMDEC1 gene expression in intestinal and splenic resident macrophages. Mouse intestinal macrophages express very high levels of ADAMDEC1 compared to splenic macrophages in a healthy state. *p<0.05. Data extracted from NCBI Gene Expression Omnibus (GEO) data repository GEO ID GSE 8868.20
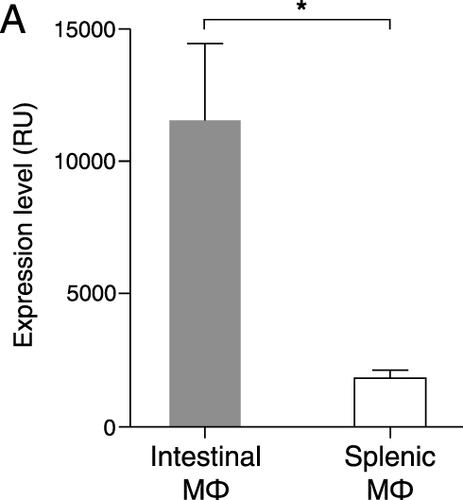
Figure 4 ADAMDEC1 gene expression in human tissue and organs is restricted to the lower gastrointestinal tract, lymph nodes, tonsils, spleen, urinary bladder and placenta (coloured in pink). (Image adapted from Human Protein Atlas available from http://www.proteinatlas.org/ENSG00000134028-ADAMDEC1/tissue).15 At the cellular level within the colon ADAMDEC1 expression has been identified in a number of macrophage populations and a subpopulation of colonic mesenchymal cells.
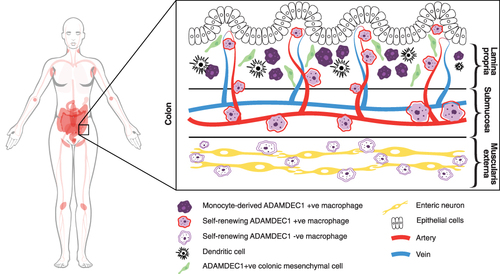
Figure 5 A possible mechanism through which a reduced expression of ADAMDEC1 in the monocyte-derived macrophages in the lamina propria could lead to chronic mucosal inflammation of Crohn’s disease.
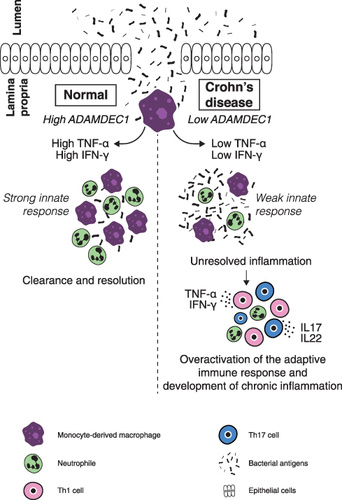
Figure 6 ADAMDEC1 and CD68 gene expression in normal colorectal tissue, colorectal adenoma and CRC. A highly significant reduction in the level of ADAMDEC1 expression is seen in the colorectal adenoma and CRC compared to the normal colorectal tissue. The CD68 expressions are comparable between the three different colorectal tissues suggesting that the number of intestinal macrophages remains unchanged. ****p<0.0001. Data extracted from Gene Expression Omnibus (GEO) data repository: GEO ID GSE 100179.57
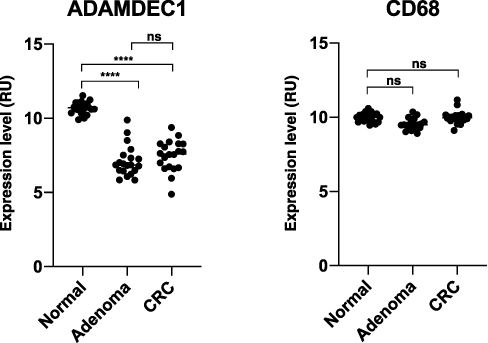
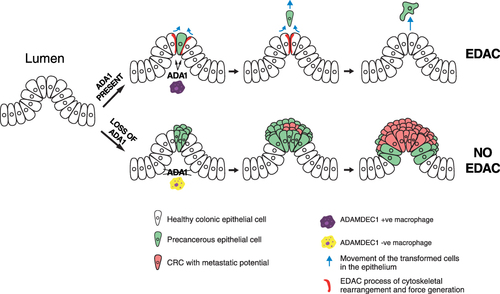
Figure 7 A possible mechanism in which a loss of ADAMDEC1 facilitates the development of colorectal adenoma and CRC by hindering EDAC.