32
Views
0
CrossRef citations to date
0
Altmetric
ORIGINAL RESEARCH

Serum NPTX2 as a Potential Predictive Biomarker for Postoperative Delirium in Patients with Acute Type A Aortic Dissection

ORCID Icon, ORCID Icon, ORCID Icon, ORCID Icon, , , , & show all
Pages 979-987 | Received 21 Feb 2024, Accepted 06 May 2024, Published online: 08 May 2024

Figures & data

Figure 1 The study flowchart, analysis of the association between serum NPTX2 levels and the occurrence of POD, a correlation matrix of variables, and ROC curve analysis. (A) Flow chart of the study. (B) The preoperative serum NPTX2 level was significantly lower in the POD group compared to the Non-POD group. (C) Incidence of POD in relation to quartiles of preoperative serum NPTX2 level. (D) The postoperative serum NPTX2 level was significantly lower in the POD group compared to the Non-POD group. (E) Incidence of POD in relation to quartiles of postoperative serum NPTX2 levels. (F) Correlation matrix of the variables. (G) ROC curve analysis of preoperative and postoperative serum NPTX2 levels for distinguishing POD (n=62). **P < 0.01, ***P < 0.001.

Abbreviations: CPB, cardiopulmonary bypass; Cr, creatinine; DHCA, deep hypothermic circulatory arrest; GERAADA, German Registry of Acute Aortic Dissection Type A; Glu glucose; Hb, hemoglobin; NPTX2, neuronal pentraxin 2; PLT, platelet; POD postoperative delirium; ROC, receiver operating characteristics.
Figure 1 The study flowchart, analysis of the association between serum NPTX2 levels and the occurrence of POD, a correlation matrix of variables, and ROC curve analysis. (A) Flow chart of the study. (B) The preoperative serum NPTX2 level was significantly lower in the POD group compared to the Non-POD group. (C) Incidence of POD in relation to quartiles of preoperative serum NPTX2 level. (D) The postoperative serum NPTX2 level was significantly lower in the POD group compared to the Non-POD group. (E) Incidence of POD in relation to quartiles of postoperative serum NPTX2 levels. (F) Correlation matrix of the variables. (G) ROC curve analysis of preoperative and postoperative serum NPTX2 levels for distinguishing POD (n=62). **P < 0.01, ***P < 0.001.

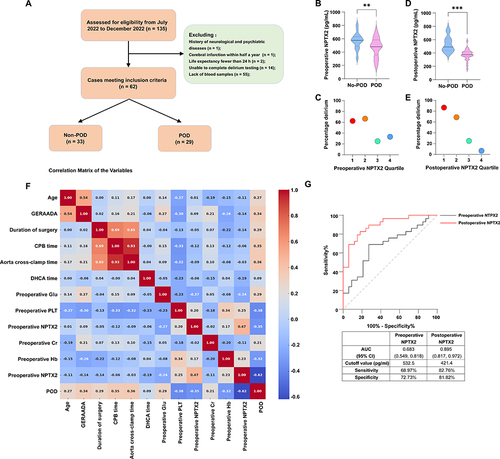
Table 1 Characteristics of Patients with or Without POD

Table 2 Multivariate Logistic Regression Analysis of POD Risk Factors