Figures & data
Figure 1 Examples of patterns of VF loss on HVFs (Swedish Interactive Threshold Algorithm 24-2) as defined in this study.
Abbreviations: VF, visual field; HVF, Humphrey visual field.
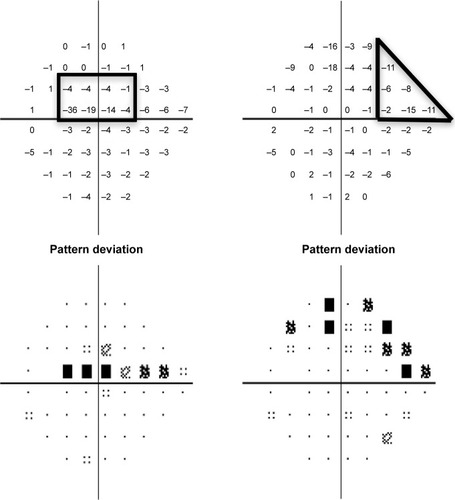
Figure 2 Quantitative assessment of the ONH with SS-OCT in an eye with early paracentral loss and in an eye with isolated peripheral loss.
Abbreviations: BMO-MRW, minimum rim width at Bruch’s membrane opening; LCDH, horizontal lamina cribrosa depth; LCDV, vertical lamina cribrosa depth; ONH, optic nerve head; RNFL, retinal nerve fiber layer; HVF, Humphrey visual field; SS-OCT, swept-source optical coherence tomography; SD-OCT, spectral-domain optical coherence tomography.
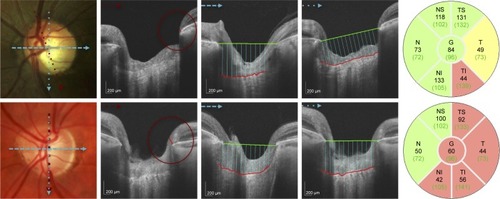
Table 1 Clinical characteristics among the studied groups
Table 2 Quantitative parameters among the studied group
Table 3 Multivariate linear regression for the measurement of minimal BMO-MRW
Figure S1 Diagram showing scans included in each sector for calculating sector BMO-MRW in a right eye.
Notes: N: 10, 11, 12, 1, 2, 3, 4; SN: 5, 6, 7; ST: 8, 9, 10; T: 11, 12, 1, 2, 3; IT: 4, 5, 6; IN: 7, 8, 9. Similarly, the corresponding scans were used for calculating sector BMO-MRW in left eyes.
Abbreviations: BMO-MRW, minimum rim width at Bruch’s membrane opening; N, nasal; SN, superonasal; ST, superotemporal; T, temporal; IT, inferotemporal; IN, inferonasal.
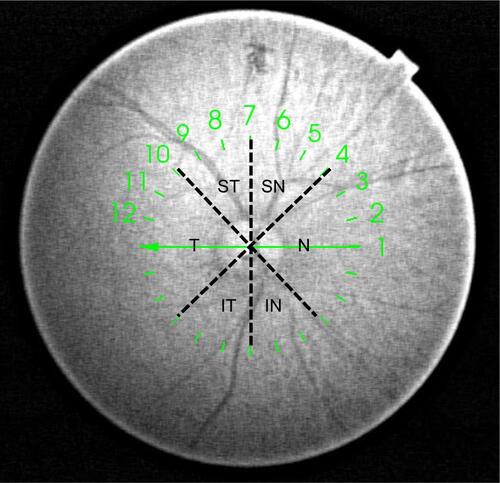
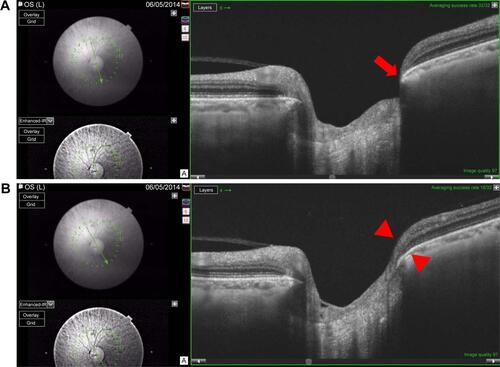
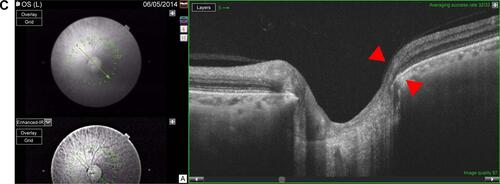
Figure S2 Example of a left eye with early paracentral loss.
Notes: The corresponding visual field test is shown in left side. The minimal BMO-MRW is 34.8 μm and the minimal sector BMO-MRW, as an average over three adjacent scans, is thicker at 92.4 μm. (A) Minimal BMO-MRW (34.8 μm) is in the inferotemporal sector (red arrow) on scan 6. (B) BMO-MRW in the inferotemporal sector (red arrowheads) is 109.3 μm on scan 5. (C) BMO-MRW in the inferotemporal sector (red arrowheads) is 133.0 μm on scan 4.
Abbreviation: BMO-MRW, minimum rim width at Bruch’s membrane opening.