
Figures & data
Table 1 Subject Demographics
Figure 1 Average logMAR acuity (± SE) for all amblyopes for each office visit. An ANOVA (p < 0.001) indicated there was a change in acuity across visits. Post-hoc Dunnett multiple comparisons indicated that weeks 4 through 24 (indicated by the filled circles) are significantly different from baseline (week 0). Acuities at weeks 12 and 24 were not significantly different (paired t-test, t8 = 1.34, p = 0.22).
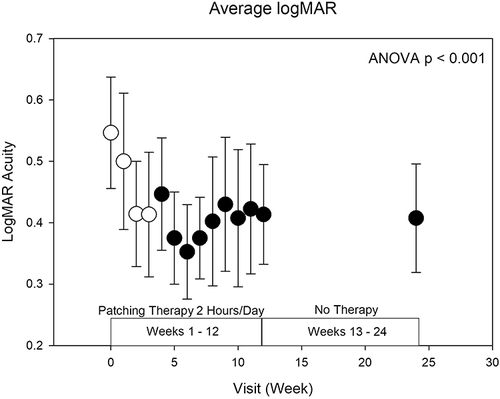
Table 2 Amblyopic Eye Subject Data for the AULCSF and CSF VA in Cycles per Degree (Cpd) for Baseline and the Week 12 Visit. The logMAR VA is Shown for the Baseline and Weeks 12 and 24 Visits. The Baseline and Week 12 or 24 Data are Statistically Significantly Different (paired t-tests, p < 0.05).
Figure 2 Average visual acuity (± SE) for all subjects (N = 9), anisometropic subjects (N = 3), and combined mechanism subjects (N = 6) for the baseline and week 24 visit. The baseline and week 24 acuities are different for all the subjects (p = 0.008) and the combined mechanism subjects (p = 0.04).
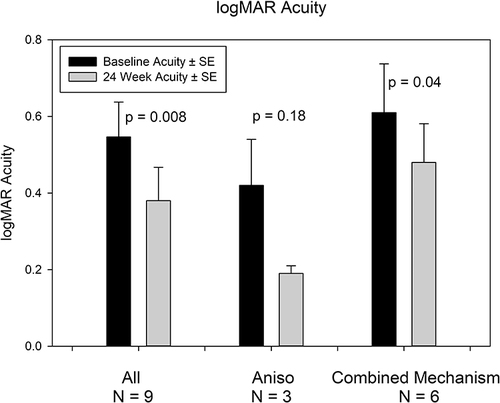
Figure 3 Patient acuity improvement in letters between baseline and week 12 versus age. The circles refer to patients that had prior patching therapy. The squares refer to patients that either had no prior patching therapy (18 year old patient) or had prior strabismus surgery (42 year old patient). The therapy compliance is given next to each data point. The data points with an “A” are the anisometropic subjects. The best fit line and equation are shown. The acuity improvement decreases 2.2 letters for each decade of life.
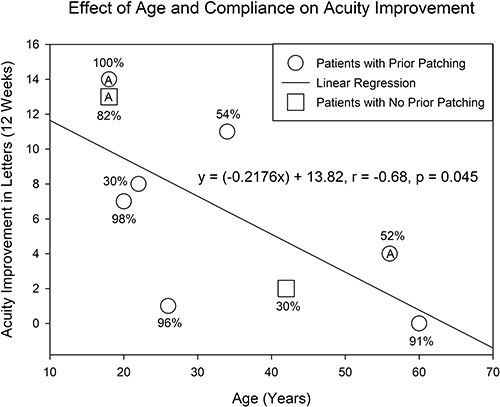
Figure 4 The average contrast sensitivity for all the subjects at baseline and week 12. An ANOVA indicated that the baseline and week 12 data are significantly different (p = 0.002). A post-hoc paired t-test analysis indicated that the data at 1.5, 3, and 6 cpd (p values below the symbols) are significantly different (indicated with an asterisk) at baseline and 12 weeks.
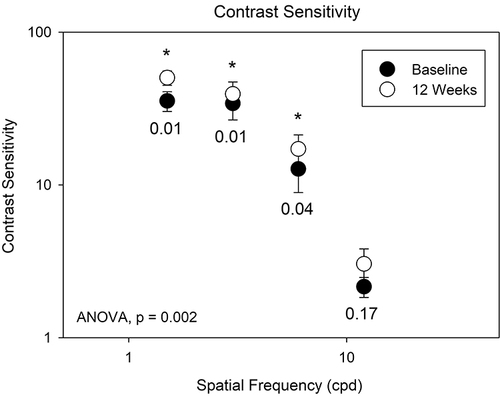
Table 3 The Baseline, 12-, and 24-Week Visit Stereopsis Results for the Subjects