Figures & data
Figure 1 Positively polarized Cross test.
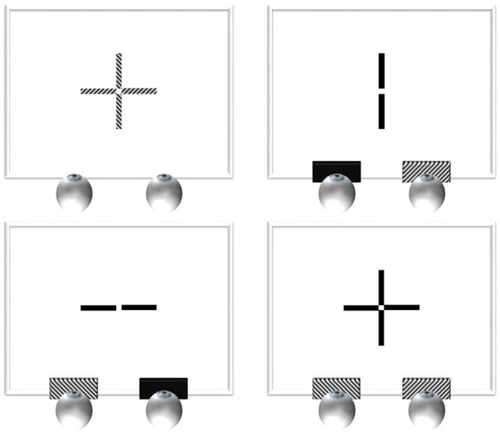
Table 1 Occurrence of distance associated HTF
Figure 2 Histogram of frequency representation of distance horizontal associated HTFs.
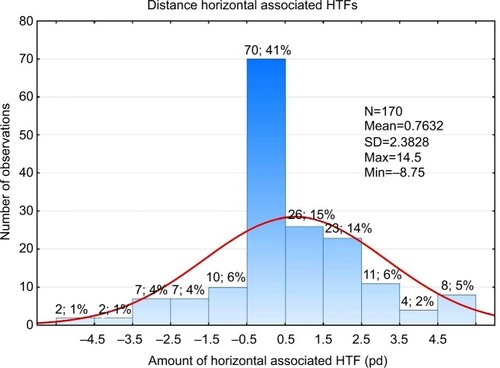
Figure 3 Histogram of frequency representation of distance vertical associated HTFs.
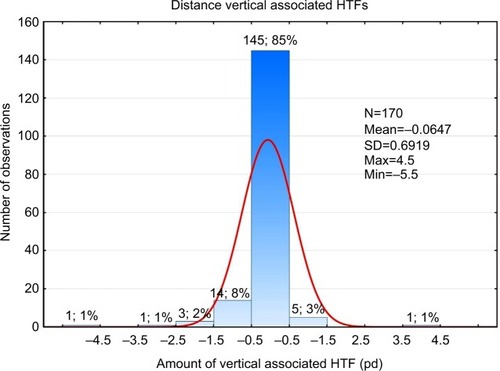
Figure 4 Histogram of frequency representation of spherical equivalent of refractive error.
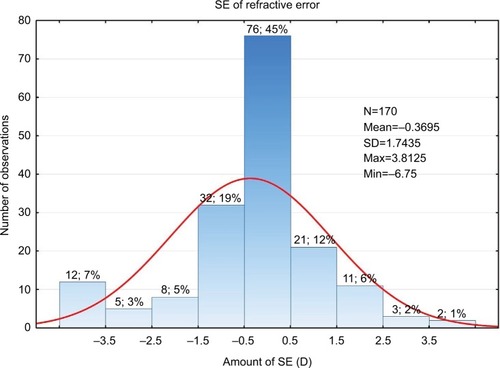
Table 2 Descriptive statistics for the total group, esophorias, and exophorias
Figure 5 Correlation between the amount of distance horizontal associated HTFs and age.
Abbreviations: HTFs, heterophorias; pd, prism diopter (Δ).
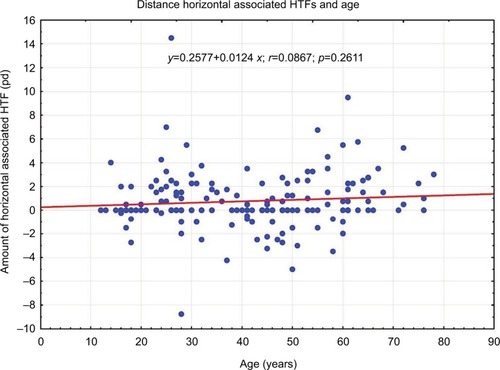
Figure 6 Correlation between the amount of distance vertical associated HTFs and age.
Abbreviations: HTFs, heterophorias; pd, prism diopter (Δ).
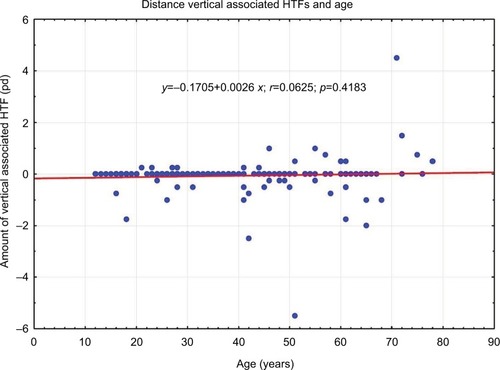
Figure 7 Box plot illustrates values of distance horizontal associated HTF for refractive errors.
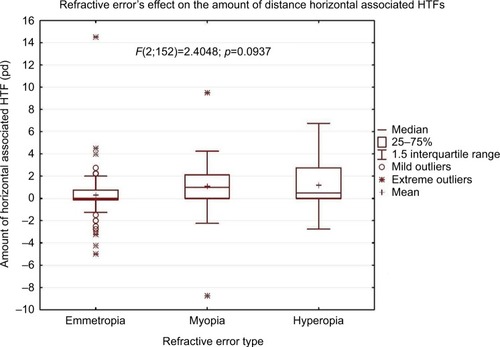
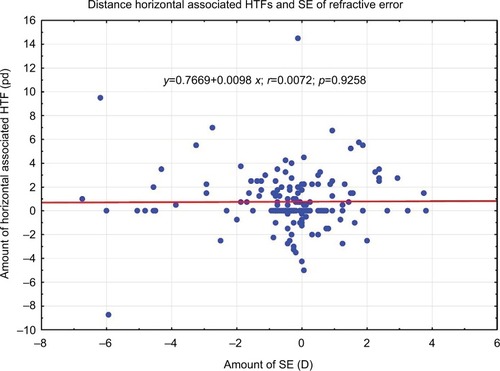
Figure 8 Correlation between amount of distance horizontal HTF and amount of spherical equivalent.
Abbreviations: D, diopter; HTFs, heterophorias; pd, prism diopter (Δ); SE, spherical equivalent.