
Figures & data
Table 1 Baseline characteristics of patients in 3D and 2D groups
Figure 1 The preoperative treatment planning for 125I seed implantation. (A) Preoperative treatment planning using the 3D visualized seed planning and navigation system and (B) preoperative dose volume histograms. A total of 90% of the tumor target received 125.24 Gy (D90=125.24 Gy), and 97.22% of the tumor target received 100% of the prescribed dose (V100=97.22%, red dashed line). D90 and D80 represent the dose such that at least 90% or 80% of the tumor volume received the reference dose, respectively. V80–V100 are the volumes that received 80%–100% reference dose, respectively.
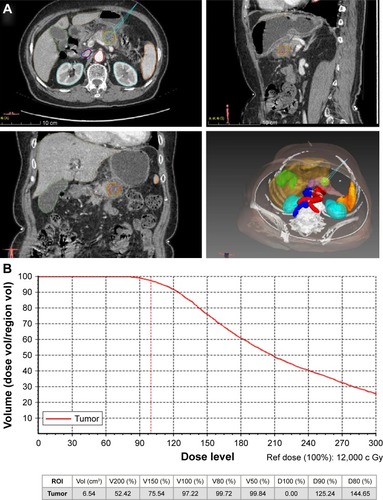
Table 2 Parameters of seed implantation procedure and local control rate
Figure 2 Images from a 63-year-old male patient diagnosed with moderately differentiated pancreatic adenocarcinoma. (A) Preoperative PET imaging; the white arrows indicate the tumor. (B–E) 1-, 3-, 6-, and 12-month CT scans, respectively, of this patient post-procedure. The lesion apparently shrunk, and the enhanced CT showed there was no activity.
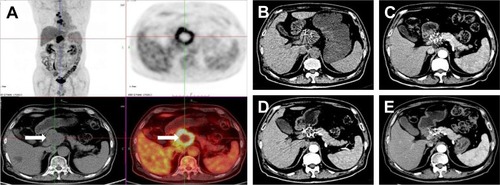
Figure 3 Cumulative overall survival rates in 3D group and 2D group. The survival rate of 3D group is significantly higher than that of 2D group (P=0.026).
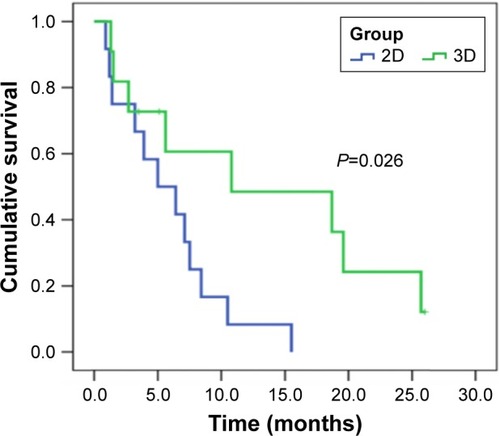
Table 3 Single factor analysis of prognostic factors for overall survival