Figures & data
Table 1 The characteristics of included studies
Figure 1 Study selection procedure with PRISMA flow diagram.
Abbreviations: PRISMA, Preferred Reporting Items for Systematic Reviews and Meta-Analyses; RCTs, randomized controlled trials.
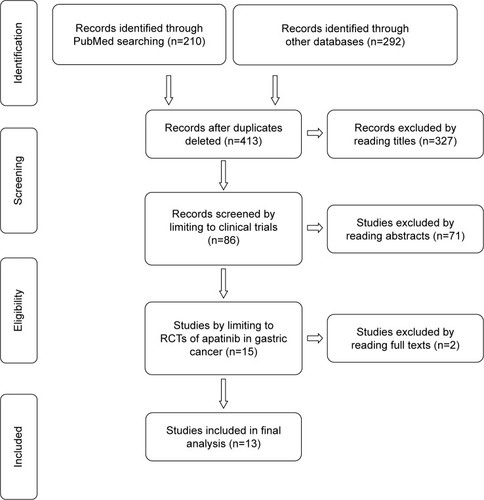
Figure 2 Forest plot of ORR (A) and DCR (B) between apatinib-alone or apatinib-based regimens and no-apatinib groups.
Abbreviations: CI, confidence interval; DCR, disease control rate; M–H, Mantel–Haenzel; ORR, objective response rate.
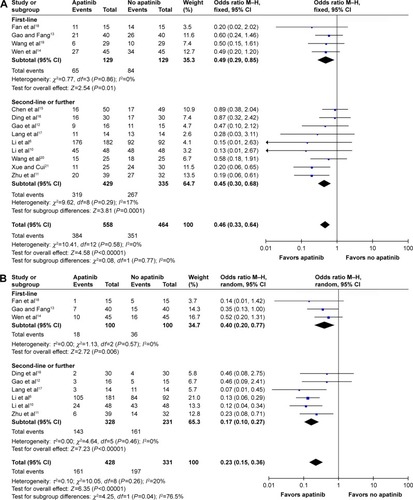
Figure 3 Forest plot of hematological toxicity (A), digestive events (B), and general events (C1 and C2) between apatinib-alone or apatinib-based regimens and no-apatinib groups.
Abbreviations: CI, confidence interval; M–H, Mantel–Haenzel.
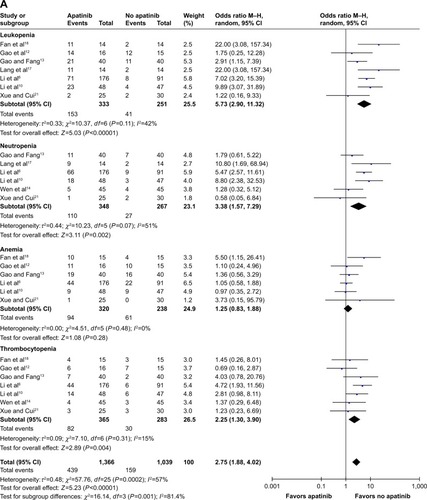
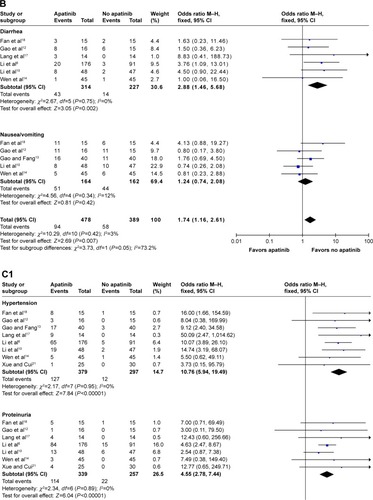
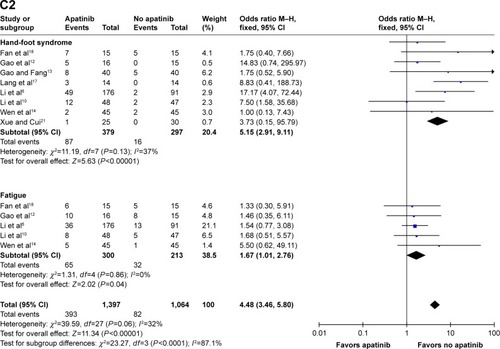
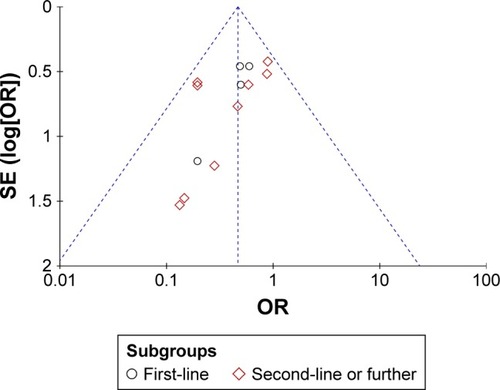
Figure 4 Funnel plot for publication bias with ORR.
Abbreviations: OR, odds ratio; ORR, objective response rate; SE, standard error.