Figures & data
Figure 1 Survivin expression is upregulated in skin cancer patients and cell lines.
Notes: (A) q-PCR analysis of the relative survivin mRNA levels in skin cancer tissues and nearby normal skin tissues from 15 skin cancer patients. (B) Western blot analysis of the protein levels of survivin from six skin cancer patients. Relative expression levels of survivin mRNAs (C) and survivin protein (D) in skin cancer cells A431 and normal skin cells HaCaT (n=3). All data are expressed as mean ± SD. *P<0.05 and **P<0.01.
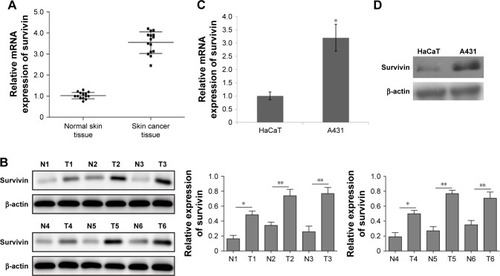
Figure 2 Adenovirus-mediated survivin shRNA downregulated survivin expression in A431 cells.
Notes: (A) Survivin-sh2 transfection efficiency was measured with microscopy by GFP expression in A431 cells. Scale bar: 500 µm. q-PCR (B) and Western blot (C) analysis of survivin levels in cells infected with control-shNC and survivin-shRNAs. All data are expressed as mean ± SD. *P<0.05 and **P<0.01.
Abbreviations: GFP, green fluorescent protein; ns, not significantly different.
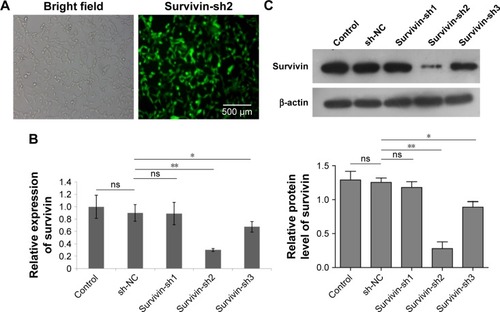
Figure 3 Survivin knockdown promoted A431 cell apoptosis through regulation of caspases.
Notes: (A) Cell viability was measured by MTT assay in A431 cells transfected with survivin-sh2 and shRNA-NC or treated with Res. (B) Cell apoptosis was detected using flow cytometry of Annexin V-FITC/PI staining. Lower left quadrant, viable cells (Annexin V-FITC and PI negative); lower right quadrant, early apoptotic cells (Annexin V-FITC positive and PI negative); upper right quadrant, late apoptosis/necrosis cells (Annexin V-FITC and PI positive). The percentage of early and late apoptotic cells was shown in the lower right and upper right panels, respectively. (C) Western blot analysis of survivin and apoptosis-related caspases (caspases 3/7/9) in control cells, transfected with shRNA-NC, survivin-shRNA, or treated with Res. All experiments were performed at least three times. All data are expressed as mean ± SD. *P<0.05, **P<0.01 and ***P<0.001.
Abbreviations: Res, resveratrol; ns, not significantly different.
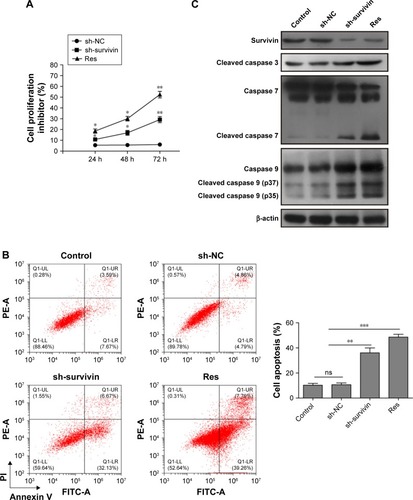
Figure 4 Survivin knockdown upregulated NF-κB protein via increasing p-ATM.
Notes: (A) Western blot analysis of p-ATM, ATM, and NF-κB levels after transfection with sh-NC, survivin-sh2, or Res treatment. (B) Western blot analysis of survivin, p-ATM, ATM, and NF-κB levels after transfection with sh-NC, survivin-sh2, or survivin-sh2 with KU-55933 treatment. (C) Cell apoptosis was determined by Annexin-V/PI staining and flow cytometry analysis in cells transfected with sh-NC, survivin-sh2, and survivin-sh2 with KU-55933 treatment. The mean ± SD in the graph presents the relative levels from three replications. *P<0.05, **P<0.01.
Abbreviations: Res, resveratrol; p-ATM, phosphorylated ataxia-telangiectasia mutated; ns, not significantly different.
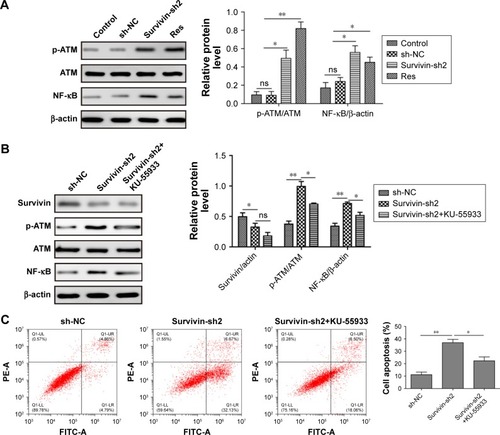
Figure 5 Antitumor effects of survivin-shRNA on skin cancer in vivo.
Notes: (A) Representative images of tumors in mice bearing A431 xenograft tumors after transfection of survivin-sh2 or shRNA-NC or administration of Res. (B, C) Quantifications of tumor weight (B) and tumor volume (C) in displayed four groups. *P<0.05 and **P<0.01 vs sh-NC, #P<0.05 vs control. (D) Western blot analysis of survivin levels in four groups of mice. (E) Cell apoptosis was determined by TUNEL assay in four groups of mice. The mean ± SD in the graph presents the relative levels from three replications. *P<0.05 vs sh-NC, #P<0.05 vs control, n=5.
Abbreviations: Res, resveratrol; shRNA, short interfering RNA; ns, not significantly different.
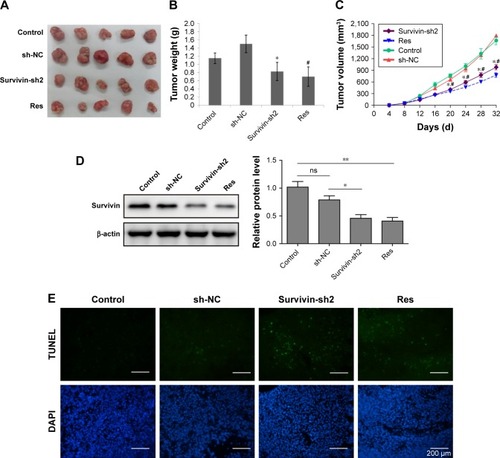
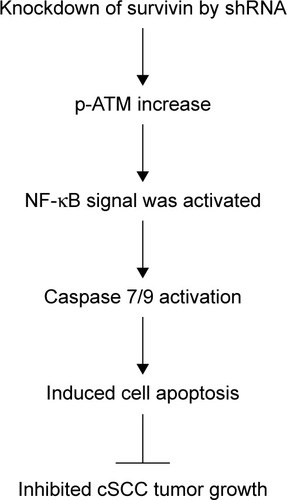
Figure 6 Working model of cell apoptosis induced by knockdown of survivin in cSCC.
Notes: Knockdown of survivin in cancer cells induces an increase of phosphorylated ATM and thus activates NF-κB signaling. NF-κB translocates into nuclear and activates caspase 7/9, which promotes cell apoptosis. Therefore, cSCC tumor growth inhibited.
Abbreviations: cSCC, cutaneous squamous cell carcinoma; p-ATM, phosphorylated ataxia-telangiectasia mutated; shRNA, short interfering RNA.