
Figures & data
Figure 1 Autophagy inhibitors circumvent bone marrow stromal cell-mediated protection against vorinostat cytotoxicity in CLL cells.
Abbreviations: CLL, chronic lymphocytic leukemia; Ctrl, control cells without treatment; Vor, vorinostat treatment; Single-CLL, CLL cells cultured alone; Co-CLL, CLL cells co-cultured with NKtert cells; PI, propidium iodide; CQ, chloroquine treatment; 3-MA, 3-methyladenine treatment.
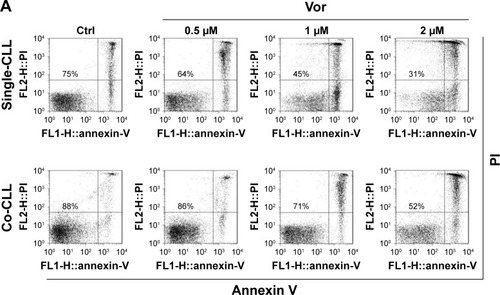
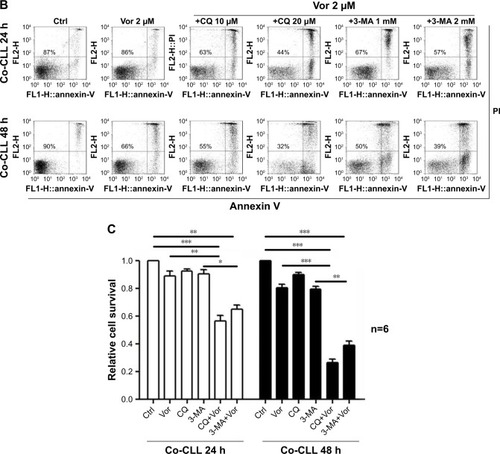
Figure 2 Vorinostat induces autophagy and mitophagy in NKtert cells co-cultured with CLL cells.
Abbreviations: CLL, chronic lymphocytic leukemia; LC3, light chain 3; Co-CLL, CLL cells co-cultured with NKtert cells; Single-CLL, S-CLL, CLL cells cultured alone; CQ, chloroquine treatment; Ctrl, control cells without treatment; V, Vor, vorinostat treatment; GFP, green fluorescent protein; Co-NKtert, NKtert cells co-cultured with CLL cells; Single-NKtert, S-NKtert, NKtert cells cultured alone; Hsp60, heat shock protein 60; COX IV, cytochrome c oxidase subunit IV.
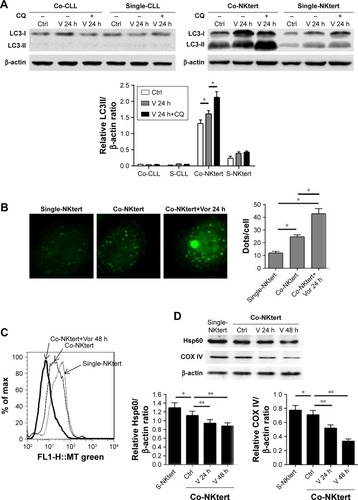
Figure 3 Release of H2O2 by CLL cells is essential to induce autophagy and mitophagy in bone marrow stromal cells.
Abbreviations: CLL, chronic lymphocytic leukemia; Single-NKtert, NKtert cells cultured alone; Co-NKtert, NKtert cells co-cultured with CLL cells; Co-CLL, CLL cells co-cultured with NKtert cells; Vor, vorinostat treatment; Single-CLL, CLL cells cultured alone; Ctrl, control cells without treatment; Hsp60, heat shock protein 60; COX IV, cytochrome c oxidase subunit IV; LC3, light chain 3; CQ, chloroquine treatment; GSH, glutathione.
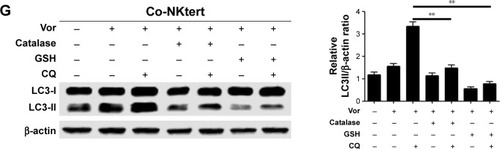
Figure 4 Vorinostat activates glycolysis in stromal cells cultured with CLL cells.
Abbreviations: CLL, chronic lymphocytic leukemia; Single-NKtert, NKtert cells cultured alone; Co-NKtert, NKtert cells co-cultured with CLL cells; V, Vor, vorinostat treatment; Ctrl, control cells without treatment; Glut-1, glucose transporter-1; HK-II, hexokinase-II.
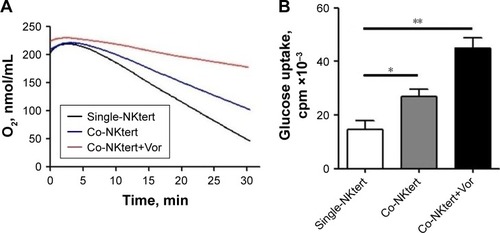
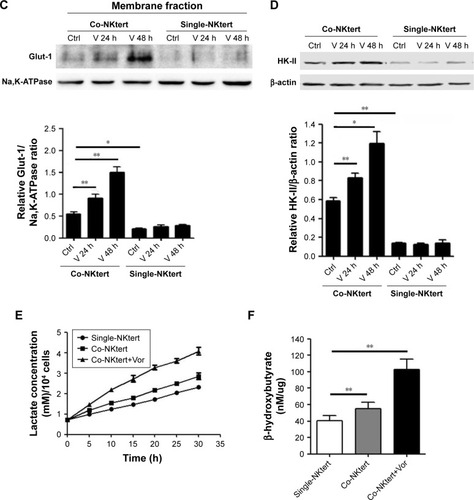
Figure 5 Glycolytic products of stromal cells maintain mitochondrial metabolic function and survival of CLL cells.
Abbreviations: CLL, chronic lymphocytic leukemia; Vor, vorinostat treatment; GSH, glutathione; PI, propidium iodide; Single-CLL, CLL cells cultured alone; Co-CLL, CLL cells co-cultured with NKtert cells; L, lactate; K, ketone body; NC, non-targeting siRNA control; NC-NKtert, NKtert cells infected with non-targeting siRNA control; SiAtg5-NKtert, NKtert cells infected with Atg5 siRNA.
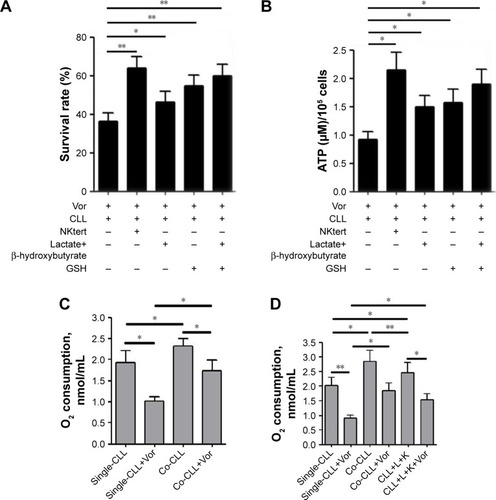
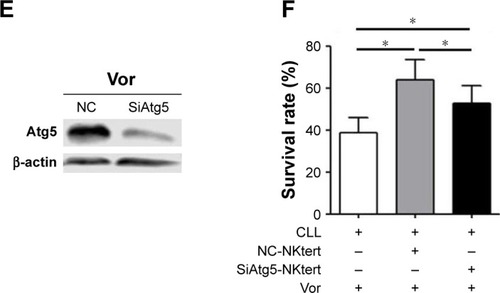
Figure 6 The combination of autophagy inhibitor and vorinostat circumvents stromal-mediated drug resistance in CLL cells.
Abbreviations: CLL, chronic lymphocytic leukemia; CQ, chloroquine; 3-MA, 3-methyladenine; Ctrl, control cells without treatment; Vor, vorinostat treatment; PI, propidium iodide.
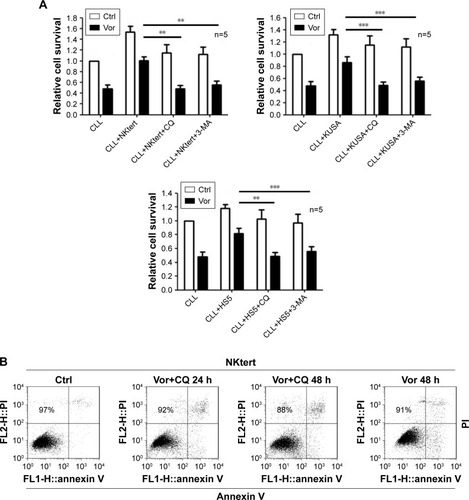
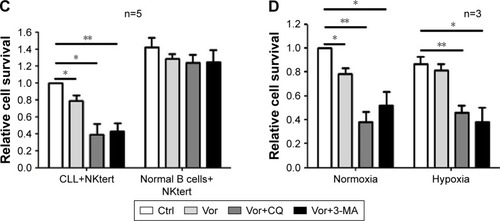
Table S1 Clinical and biological characteristics of 101 chronic lymphocytic leukemia patients