Figures & data
Figure 1 Schematic diagram of TALNBs constructed for drug targeted delivery and particle size analysis.
Notes: (A) Fabrication of TALNBs. (B) Schematic diagram of the targeted therapeutic strategy by UTND for synergistic chemotherapy. (C) Average particle size of NALNBs determined by laser particle size analysis. (D) Average particle size of TALNBs determined by laser particle size analysis. No significant difference in particle size was found between NALNBs and TALNBs (P>0.05).
Abbreviations: TALNBs, GPC3-targeted and apatinib-loaded nanobubbles; UTND, ultrasound-targeted nanobubble destruction; NALNBs, nontargeted and apatinib-loaded nanobubbles.
Abbreviations: TALNBs, GPC3-targeted and apatinib-loaded nanobubbles; UTND, ultrasound-targeted nanobubble destruction; NALNBs, nontargeted and apatinib-loaded nanobubbles.
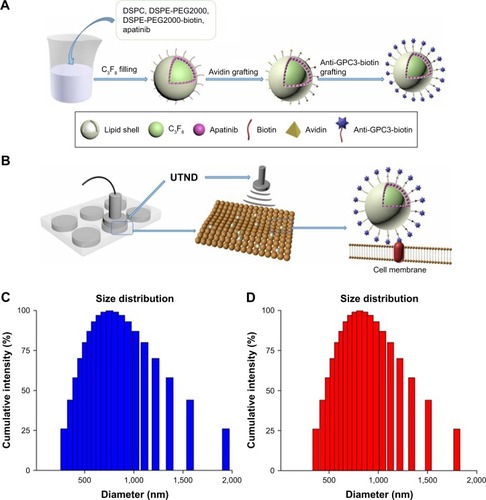
Figure 2 In vitro analysis of TALNBs.
Notes: (A) Binding ability of BALNBs with FITC-labeled streptavidin was determined by flow cytometry. Comparison of fluorescence intensities for NALNBs (red line, control) and FITC-labeled BALNBs (blue line), indicating successful binding of FITC-labeled streptavidin with BALNBs. (B) Fluorescence intensities detected by flow cytometry for different NBs types after incubation with Anti-GPC3 polyclonal antibodies and Alexa488-labeled IgG. Purple line (blank control), Alexa488-labeled NALNBs; yellow line, Alexa488-labeled BALNBs; green line, Alexa488-labeled BSALNBs. (C) Scanning electron micrographs of HepG2 cells (no treatment). Magnification 4,000×. (D) Scanning electron micrographs of HepG2 cells after incubation with TALNBs. Magnification 4,000× and 10,000×, respectively. (E) Scanning electron micrographs of HepG2 cells after incubation with NALNBs. The cells were washed with PBS 3 times before imaging. In comparison with NALNBs, TALNBs bound better with HepG2 cells. Magnification 4,000× and 10,000×, respectively.
Abbreviations: TALNBs, GPC3-targeted and apatinib-loaded nanobubbles; BALNBs, biotinylated apatinib-loaded nanobubbles; NALNBs, nontargeted and apatinib-loaded nanobubbles; FITC, fluorescein isothiocyanate; NBs, nanobubbles; BSALNBs, biotin–streptavidin and apatinib-loaded nanobubbles.
Abbreviations: TALNBs, GPC3-targeted and apatinib-loaded nanobubbles; BALNBs, biotinylated apatinib-loaded nanobubbles; NALNBs, nontargeted and apatinib-loaded nanobubbles; FITC, fluorescein isothiocyanate; NBs, nanobubbles; BSALNBs, biotin–streptavidin and apatinib-loaded nanobubbles.
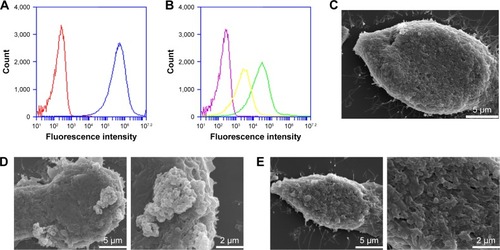
Table 1 Effects of drug loading on NB concentration, drug EE, and drug concentration of apatinib-loaded NBs
Figure 3 Ultrasonic destruction of TALNBs in the blank, unloaded NB, and NALNB groups.
Notes: The acoustic destructibility of TALNBs and NALNBs showed no statistically significant differences compared with unloaded NBs (P>0.05). Data are mean ± SD.
Abbreviations: NB, nanobubble; TALNBs, GPC3-targeted and apatinib-loaded nanobubbles; NALNBs, nontargeted and apatinib-loaded nanobubbles.
Abbreviations: NB, nanobubble; TALNBs, GPC3-targeted and apatinib-loaded nanobubbles; NALNBs, nontargeted and apatinib-loaded nanobubbles.
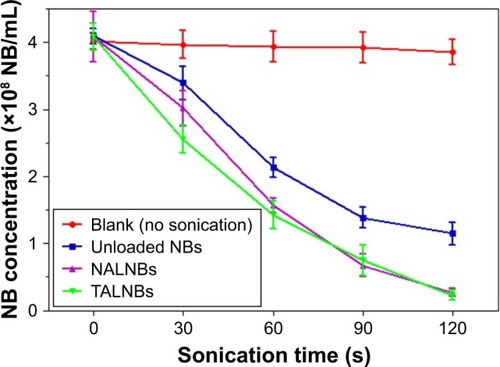
Figure 4 Quantitative growth inhibition assay in HepG2 cells after different treatments.
Notes: The proliferation inhibitory rates of cells were assessed by CCK-8 assay at 24, 48, and 72 h after treatment. Data are mean ± SD (n=3). The proliferation inhibitory rate of the TALNBs + US group was significantly higher than those of the other groups at all time points (P<0.05). *P<0.05 compared with group (e).
Abbreviations: NALNBs, nontargeted and apatinib-loaded nanobubbles; TALNBs, GPC3-targeted and apatinib-loaded nanobubbles; US, ultrasound.
Abbreviations: NALNBs, nontargeted and apatinib-loaded nanobubbles; TALNBs, GPC3-targeted and apatinib-loaded nanobubbles; US, ultrasound.
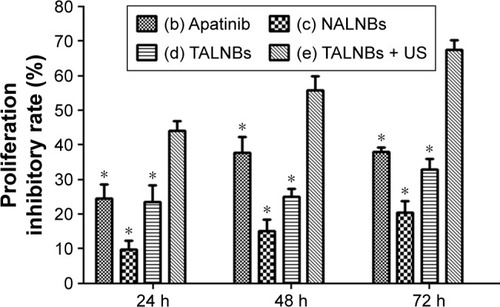
Figure 5 Flow cytometric analysis of the cell cycle in HepG2 cells after different treatments.
Notes: (A) HepG2 cells were assessed by flow cytometry 24 h after treatment. G1/M phase was significantly increased in the TALNBs + US group (e) compared with the other groups (a–d) (P<0.05). (B) Quantitative cell cycle analysis in HepG2 cells from 3 independent experiments. Data are mean ± SD. *P<0.05 compared with group (e).
Abbreviations: Dip, diploid; NALNBs, nontargeted and apatinib-loaded nanobubbles; TALNBs, GPC3-targeted and apatinib-loaded nanobubbles; US, ultrasound.
Abbreviations: Dip, diploid; NALNBs, nontargeted and apatinib-loaded nanobubbles; TALNBs, GPC3-targeted and apatinib-loaded nanobubbles; US, ultrasound.
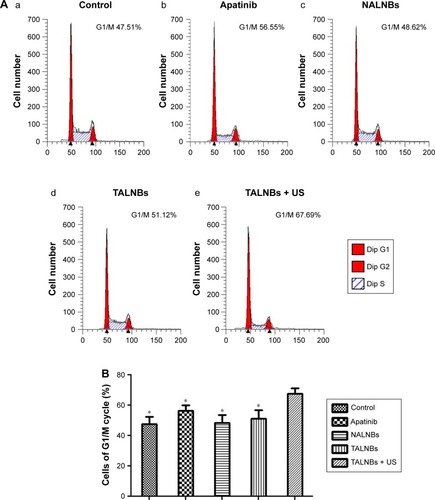
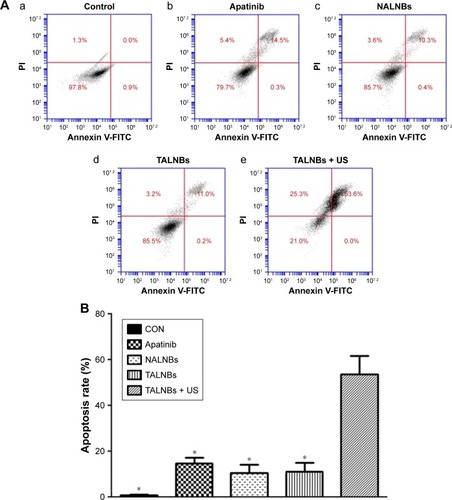
Figure 6 Flow cytometric analysis of cell apoptosis in HepG2 cells.
Notes: (A) HepG2 cells were assessed by flow cytometry 24 h after different treatments. The apoptotic rate was significantly higher in the TALNBs + US group (e) compared with the other groups (a–d) (P<0.05). (B) Quantitative apoptotic rate analysis in HepG2 cells from 3 independent experiments. Data are mean ± SD. *P<0.05 compared with the TALNBs + US group.
Abbreviations: PI, propidium iodide; NALNBs, nontargeted and apatinib-loaded nanobubbles; TALNBs, GPC3-targeted and apatinib-loaded nanobubbles; US, ultrasound.
Abbreviations: PI, propidium iodide; NALNBs, nontargeted and apatinib-loaded nanobubbles; TALNBs, GPC3-targeted and apatinib-loaded nanobubbles; US, ultrasound.