Figures & data
Table 1 Characteristics of the included studies
Figure 1 The flow chart of the literature screening process.
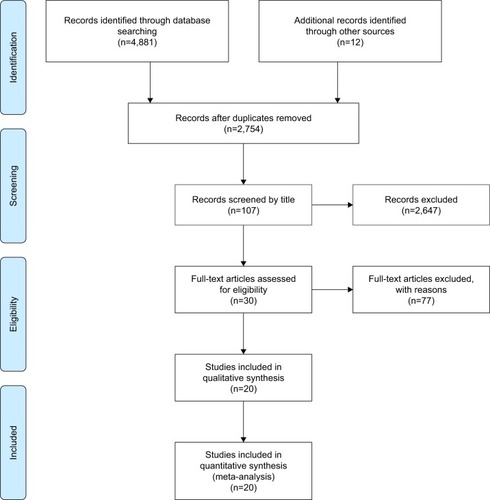
Figure 2 Meta-analysis of the tumor remission rate of cancer treated with MLT.
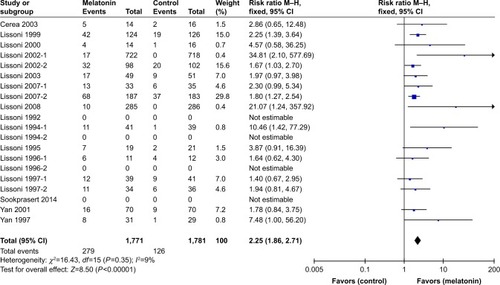
Figure 3 Meta-analysis of the overall survival rate of cancer treated with MLT.
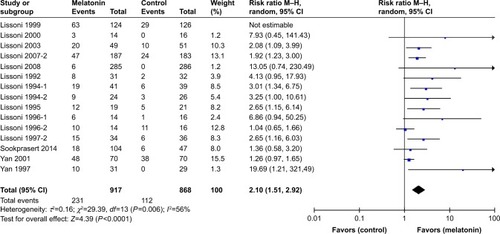
Figure 4 Meta-analysis of the overall survival rate of lung cancer treated with MLT.
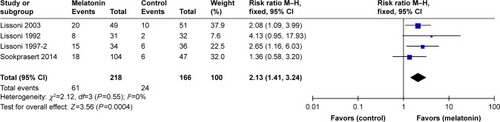
Figure 5 Meta-analysis of the overall survival rate of multiple solid cancers treated with MLT.
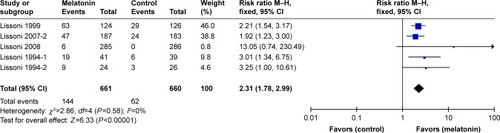
Figure 6 Meta-analysis of the neurotoxicity rate of cancer treated with MLT during chemotherapy.
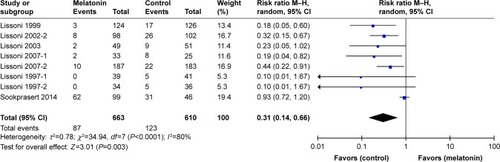
Figure 7 Meta-analysis of the neurotoxicity rate of cancer treated with MLT during chemotherapy after sensitivity analysis (removing the study of Sookprasert 2014).
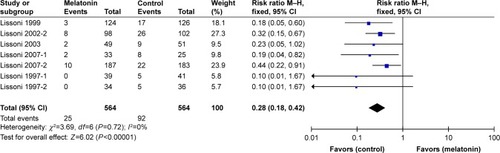
Figure 8 Meta-analysis of the thrombocytopenia rate of cancer treated with MLT during chemotherapy.
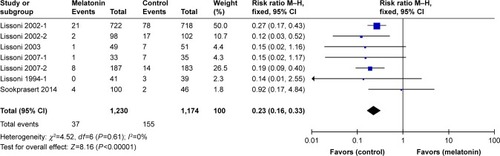
Figure 9 Meta-analysis of the asthenia rate of cancer treated with MLT during chemotherapy.
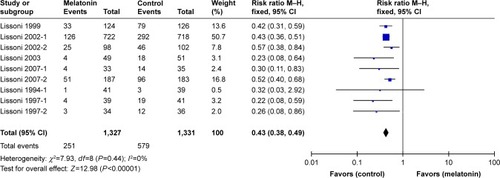
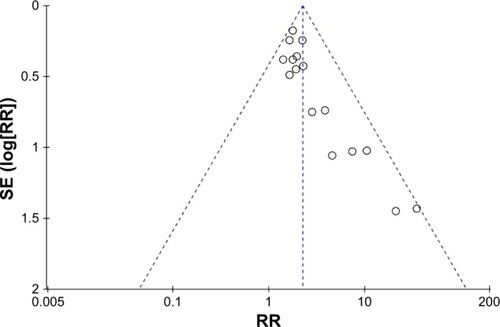
Figure 10 Funnel plot: Harbord test: t=2.2794, df =14, P-value =0.03883.