Figures & data
Table 1 Distribution of TRIM32 status in NSCLC according to clinicopathologic characteristics
Figure 1 Expression pattern of TRIM32 in NSCLC.
Notes: (A) Negative TRIM32 staining in normal bronchial epithelial tissues. (B) Strong TRIM32 staining in a case of squamous cell carcinoma. (C) Positive TRIM32 staining in a case of adenocarcinoma. (D) Negative TRIM32 staining in a case of adenocarcinoma. Magnification, 400×.
Abbreviation: NSCLC, non-small-cell lung cancer.
Abbreviation: NSCLC, non-small-cell lung cancer.
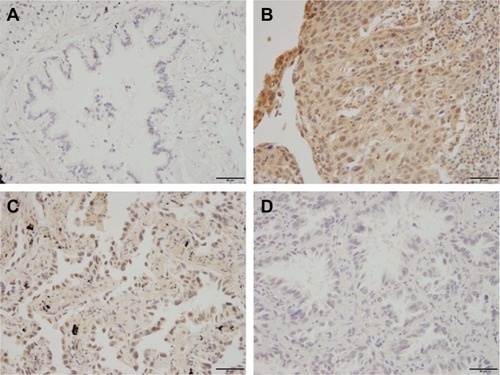
Table 2 Univariate and multivariate analyses for predictive factors in patients with NSCLC
Figure 2 TRIM32 overexpression correlates with poor prognosis.
Notes: (A) Kaplan–Meier plot of patients with NSCLC demonstrated that TRIM32 overexpression correlated with poor patient prognosis. (B) TCGA data showed that higher TRIM32 mRNA expression correlated with poor NSCLC patient prognosis.
Abbreviations: NSCLC, non-small-cell lung cancer; TCGA, The Cancer Genome Atlas.
Abbreviations: NSCLC, non-small-cell lung cancer; TCGA, The Cancer Genome Atlas.
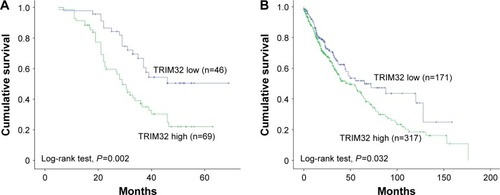
Figure 3 Expression of TRIM32 in NSCLC cell lines.
Notes: (A) Western blot of TRIM32 expression in normal cell line HBE and seven NSCLC cell lines (A549, H1299, H460, H358, H3255, H1975, H2228). (B) Western blot and PCR analysis demonstrated that TRIM32 shRNA showed a marked decrease in its mRNA and protein levels in H1299 cells. Transfection of TRIM32 plasmid significantly upregulated its mRNA and protein expression in A549 cell line. *P<0.05.
Abbreviation: NSCLC, non-small-cell lung cancer.
Abbreviation: NSCLC, non-small-cell lung cancer.
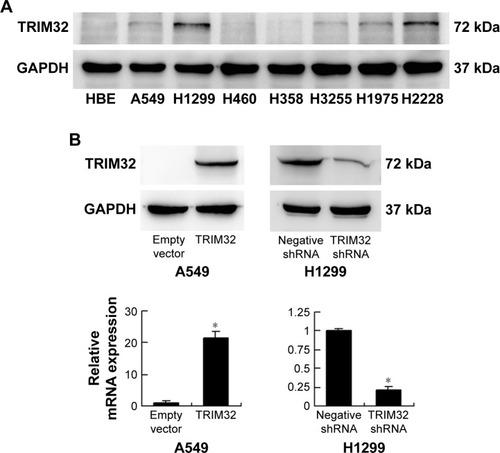
Figure 4 TRIM32 promotes cell proliferation and invasion.
Notes: (A) MTT assay showed that TRIM32 plasmid transfection facilitated cell growth rate in A549 cells, while TRIM32 shRNA downregulated the growth rate in H1299 cells. *P<0.05 at day 5. (B) TRIM32 plasmid transfection increased the colony number of A549 cells. TRIM32 shRNA decreased the colony number of H1299 cells. (C) Matrigel invasion assay demonstrated that TRIM32 overexpression significantly increased A549 invading cell number, while its depletion downregulated H1299 invading cell number. *P<0.05.
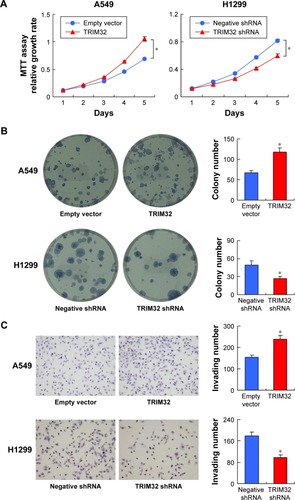
Figure 5 TRIM32 regulates chemosensitivity to cisplatin and related proteins.
Notes: (A) MTT viability showed that TRIM32 overexpression upregulated A549 viability after treatment with different concentrations of cisplatin (0, 2.5, 5, 10 µg/mL). TRIM32 depletion downregulated H1299 viability after treatment with different concentrations of cisplatin (0, 2.5, 5, 10 µg/mL). (B) The apoptosis rate was much lower in A549-TRIM32 cells than in control A549 cells under the condition of 24 hours of cisplatin (5 µg/mL) treatment. The apoptosis percentage in H1299-shTRIM32 cells was significantly increased compared with control cells when treated with 5 µg/mL cisplatin. (C) TRIM32 overexpression upregulated caspase 3 and downregulated cytochrome c and cleaved caspase 3 levels in A549 cells treated with 5 µg/mL cisplatin. TRIM32 depletion showed the opposite effects in H1299 cells. *P<0.05.
Abbreviations: FITC-H, fluorescein; PI, propidium iodide.
Abbreviations: FITC-H, fluorescein; PI, propidium iodide.
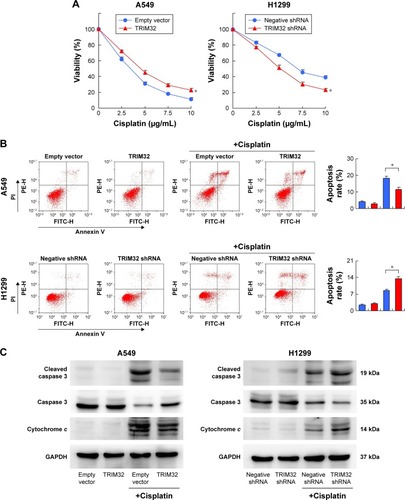
Figure 6 TRIM32 regulates the mitochondrial membrane potential and ROS.
Notes: (A) JC-1 staining showed that TRIM32 overexpression downregulated the percentage of cells with green fluorescence in A549 cells. TRIM32 depletion showed the opposite effect in H1299-shTRIM32 cells. (B) CellROX Deep Red staining demonstrated that TRIM32 overexpression reduced the level of cisplatin-induced ROS accumulation in A549 cells. TRIM32 depletion increased cisplatin-induced ROS accumulation in H1299-shTRIM32 cells.
Abbreviation: FITC-H, fluorescein.
Abbreviation: FITC-H, fluorescein.
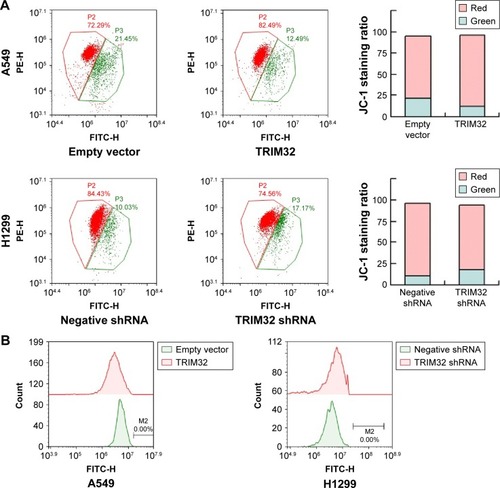
Figure 7 TRIM32 regulates NF-κB/Bcl-2 signaling.
Notes: (A) Western blot demonstrated that TRIM32 overexpression upregulated the protein expression of Bcl-2 and p-IκB. TRIM32 depletion downregulated Bcl-2 and p-IκB in H1299 cells. TRIM32 did not influence the expression of p-AKT and p-ERK. (B) QNZ (300 nM) was used to block NF-κB activation in A549 cells. QNZ downregulated Bcl-2 expression. In A549 cells treated with QNZ, the effect of TRIM32 on Bcl-2 was not significant.
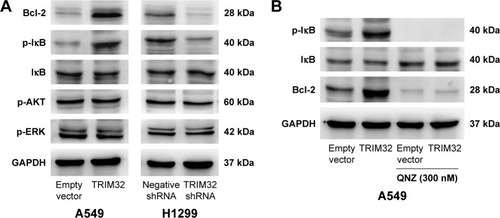
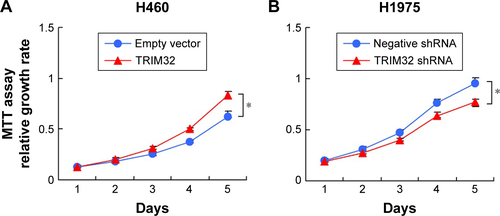
Figure S1 TRIM32 regulates cell proliferation in H460 and H1975 cell lines.
Notes: (A) MTT assay showed that TRIM32 transfection facilitated cell growth rate in H460 cells, whereas (B) TRIM32 shRNA downregulated the growth rate in H1975 cells. *P<0.05 at day 5.