Figures & data
Table 1 Clinicopathological features of 44 patients with glio-blastoma
Figure 1 miR-1225-5p is downregulated in glioblastoma and correlated with patient survival.
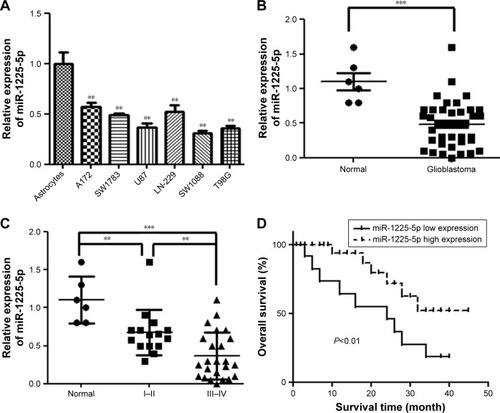
Table 2 Correlation between miR-1225-5p expression level and clinicopathological characteristics in 44 patients with glioblastoma
Figure 2 Overexpression of miR-1225-5p suppresses the proliferation of glioblastoma cells in vitro and in vivo.
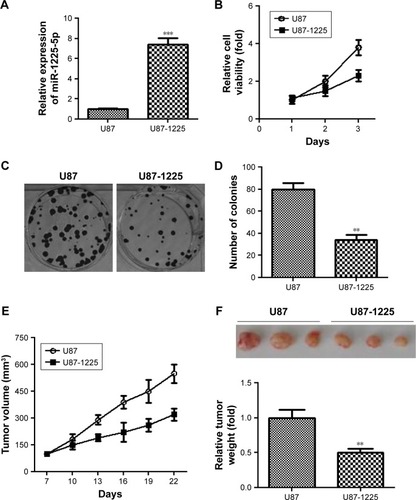
Figure 3 Overexpression of miR-1225-5p suppresses migration and invasion of glioblastoma cells.
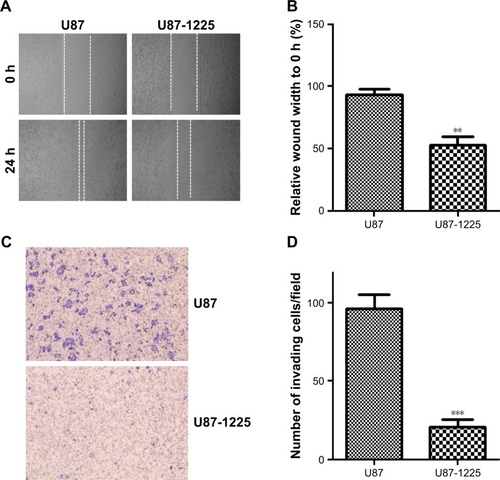
Figure 4 Insulin receptor substrate 1 (IRS1) is a direct target of miR-1225-5p in glioblastoma.
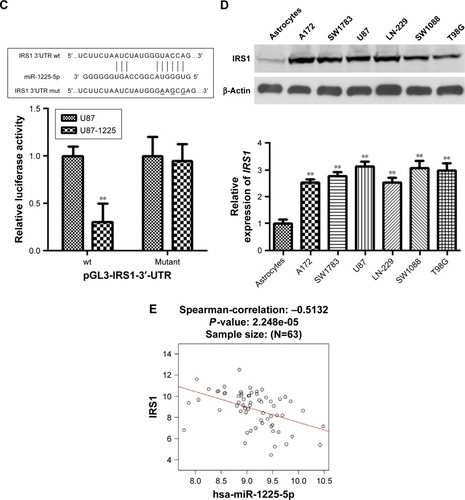
Figure S1 (A) The correlation between the miR-1225-5p level (low or high) with overall patient survival was assessed with Kaplan–Meier analysis in patients with grade I/II tumors. (B) The correlation between the miR-1225-5p level (low or high) with overall patient survival was assessed with Kaplan–Meier analysis in patients with grade III/IV tumors.
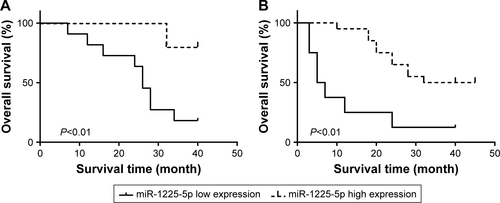
Figure S2 (A) The expression of miR-1225-5p in SW1088 and SW1088-1225 (stably expressing miR-1225-5p) cells was measured by reverse transcription PCR (RT-PCR) and normalized against U6. (B) SW1088 and SW1088-1225 cells were subjected to an MTT assay to assess cell proliferation at each time point. (C) Representative image of crystal violet-stained cell colonies analyzed by colony-formation assay at 14 days. (D) Quantification plots of (C). **P<0.01; ***P<0.001.
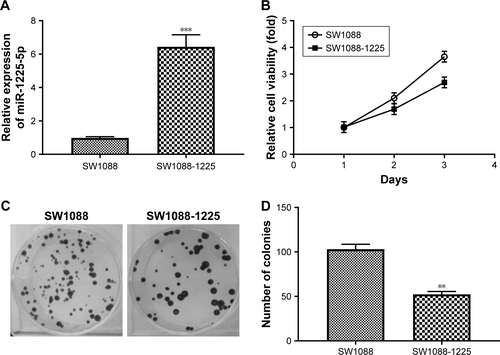
Figure S3 (A) Representative picture of SW1088 and SW1088-1225 cell migration was measured by scratch wound assay. (B) The wound healing percentage was plotted in (A). (C) Representative image of SW1088 and SW1088-1225 cell invasion using Matrigel-based invasion assay. (D) The average number of invading cells of five randomly selected fields from each sample was calculated. **P<0.01 vs SW1088 group.
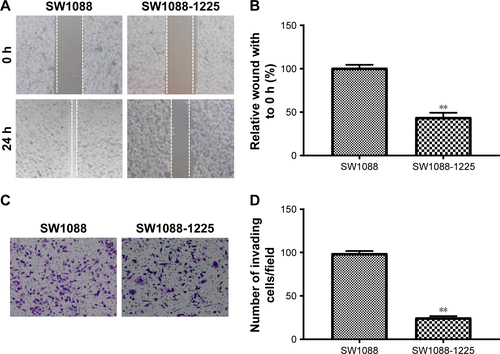
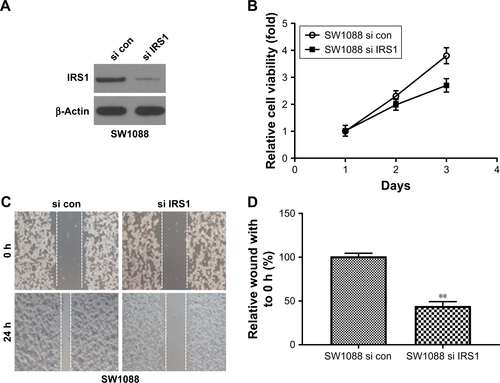
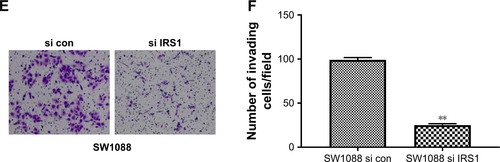
Figure S4 (A) Western blotting of IRS1 in SW1088 cell transfected with si IRS1. (B) SW1088 si con and SW1088 si IRS1 cells were subjected to an MTT assay to assess cell proliferation at each time point. (C) Representative picture of SW1088 si con and SW1088 si IRS1 cell migration was measured by scratch wound assay. (D) The wound-healing percentage was plotted in (C). (E) Representative image of SW1088 si con and SW1088 si IRS1 cell invasion using Matrigel-based invasion assay. (F) The average number of invading cells of five randomly selected fields from each sample was calculated. **P<0.01 vs SW1088 si con group.