Figures & data
Table 1 GPSM2 and GAPDH primers
Figure 1 CD133+PANC-1 cells have greater tumorigenic capacity than CD133−PANC-1 cells.
Notes: PANC-1 cells were sorted into CD133− and CD133+ subsets. To evaluate the purity of each population, the percentages of CD133+ cells in the CD133+ (A) and CD133− (B) subsets were assessed by flow cytometry. In-vivo tumorigenesis assay of CD133− and CD133+ cell subsets in nude mice. Representative mice are shown at 2 weeks after injection (C). Subcutaneous tumor growth in nude mice. Results represent the averages of volumes from six mice as estimated using calipers (D). Representative tumors from CD133− and CD133+ cells after 4 weeks (E). Average mass of tumors from the two groups of mice (F). (**P<0.01).
Abbreviation: FITC, fluorescein isothiocyanate.
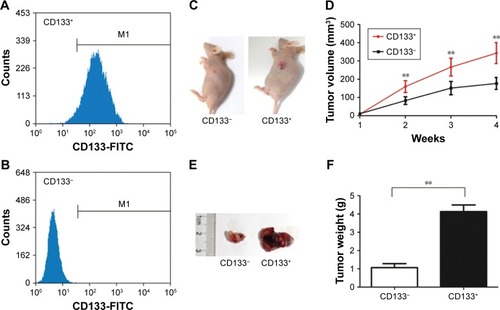
Figure 2 GPSM2 expression is elevated in CD133+PANC-1 cells.
Notes: GPSM2 mRNA expression in unselected PANC-1 cells (Total), CD133−PANC-1 cells (CD133−), and CD133+PANC-1 cells (CD133+) (A). GPSM2 protein expression of PANC-1 cells in each group (B). Results are representative of three independent experiments. (*P<0.05, **P<0.01).
Abbreviations: GAPDH, glyceraldehyde-3-phosphate dehydrogenase; GPSM2, G-protein-signaling modulator 2.
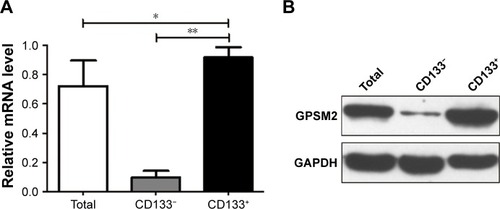
Table 2 Comparison of cell growth inhibition rates (%) between shGPSM2 and shNC cells
Figure 3 Downregulation of GPSM2 inhibits proliferation of CD133+PANC-1 cells.
Notes: GPSM2 mRNA expression in untransfected (Blank), shNC, and shGPSM2 CD133-positive PANC-1 cells (A). GPSM2 protein expression in each group (B). Cell proliferation rates as assessed by MTT assay (C). Results are representative of three independent experiments. (*P<0.05, **P<0.01 vs Blank group; #P<0.05 vs shNC group).
Abbreviations: GAPDH, glyceraldehyde-3-phosphate dehydrogenase; GPSM2, G-protein-signaling modulator 2.
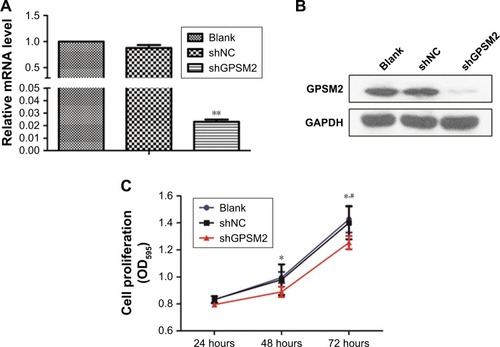
Figure 4 Downregulation of GPSM2 inhibits the colony formation ability of CD133+PANC-1 cells.
Notes: Representative images of colony formation by untransfected (Blank), shNC, and shGPSM2 CD133+PANC-1 cells (A). The average number of colonies per group (*P<0.05) (B).
Abbreviation: GPSM2, G-protein-signaling modulator 2.
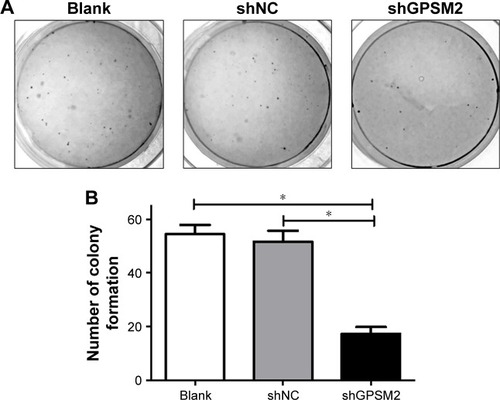
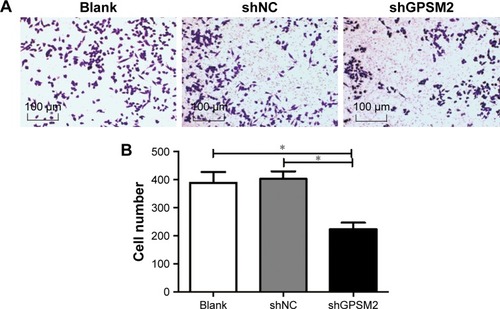
Figure 5 Downregulation of GPSM2 inhibits the migration ability of CD133+PANC-1 cells.
Notes: Representative images of migrating cells in Transwell assays for untransfected (Blank), shNC, shGPSM2, and CD133+PANC-1 cells (A). The average number of colonies per group. (*P<0.05) (B).
Abbreviation: GPSM2, G-protein-signaling modulator 2.