
Figures & data
Table 1 PRISMA checklist
Figure 1 Selection of studies. Flow diagram demonstrating the identification and selection process of articles included in the meta-analysis.
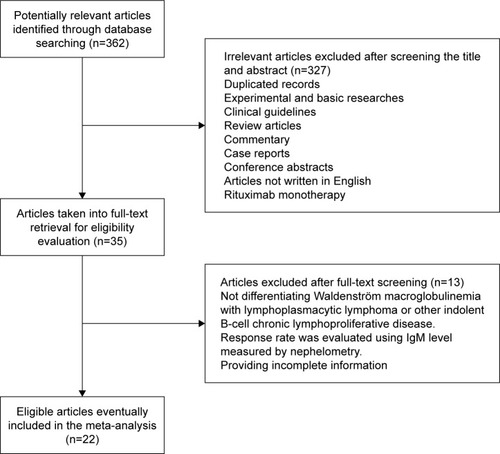
Table 2 Patient characteristics and treatment outcomes of the included studies
Figure 2 Pooled overall response rate (double arcsine form) of rituximab-based combinations in patients with Waldenström macroglobulinemia. The diamond indicates the estimated overall response rate and their corresponding 95% CI (double arcsine form after Freeman–Tukey transformation).
Note: Weights are from random-effects analysis.
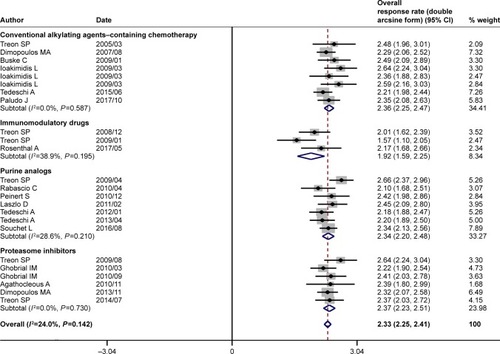
Figure 3 Pooled major response rate (double arcsine form) of rituximab-based combinations in patients with Waldenström macroglobulinemia. The diamond indicates the estimated major response rate and their corresponding 95% CI (double arcsine form after Freeman–Tukey transformation).
Note: Weights are from random-effects analysis.
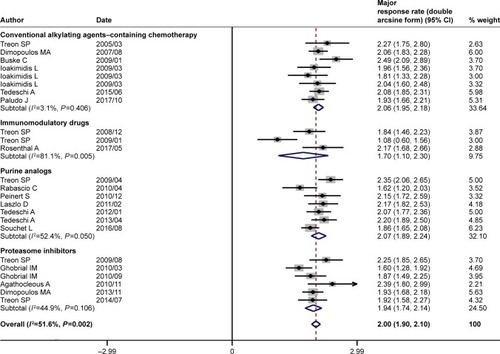
Figure 4 Pooled complete response rate (double arcsine form) of rituximab-based combinations in patients with Waldenström macroglobulinemia. The diamond indicates the estimated complete response rate and their corresponding 95% CI (double arcsine form after Freeman–Tukey transformation).
Note: Weights are from random-effects analysis.
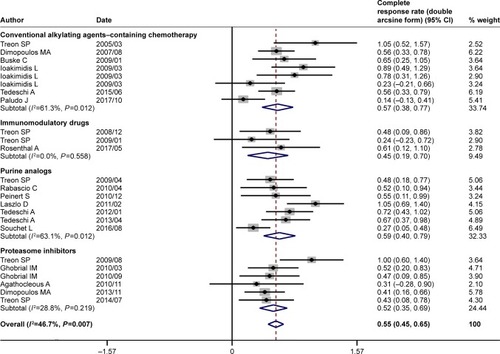
Figure 5 Summary of pooled response rate (original form) of rituximab-based combinations and different subgroups in patients with Waldenström macroglobulinemia. (A) Pooled ORR. (B) Pooled MRR. (C) Pooled CRR. (D) The percentage bar diagram for overall and subgroups A, B, C, and D for ORR, CRR, and MRR. Subgroup A represents rituximab plus conventional alkylating agents–containing chemotherapy group; subgroup B represents rituximab plus purine analog group; subgroup C represents rituximab plus proteasome inhibitor group; and subgroup D represents rituximab plus immunomodulatory drug group. *P<0.007143. The diamond indicates the estimated response rate and their corresponding 95% CI (original form).
Note: Weights are from random-effects analysis.
Abbreviations: CRR, complete response rate; MRR, major response rate; ORR, overall response rate.
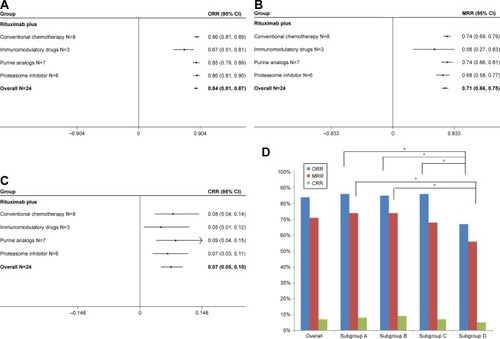
Table 3 Comparison between different subgroups of ORR, MRR, and CRR
Figure 6 Pooled rates of grade ≥3 hematological adverse events of rituximab-based combinations. Rates (double arcsine form after Freeman–Tukey transformation) of (A) anemia, (B) neutropenia, (C) thrombocytopenia, and (D) summary of grade ≥3 anemia, neutropenia, and thrombocytopenia (original form).
Note: Weights are from random-effects analysis.
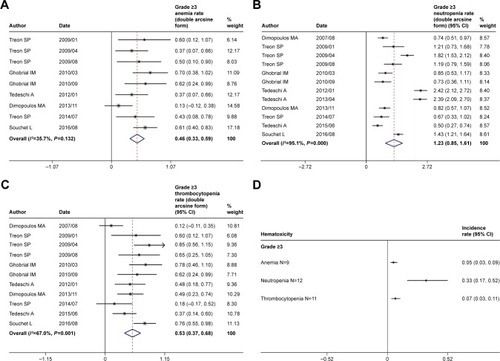
Table 4 Publication bias assessment of the pooled results
Data availability statement
Our meta-analysis overviewed and extracted data from the previously published articles, all of which are cited in the manuscript and can be found online. The processed data are available from the corresponding author upon request.