Figures & data
Figure 1 The effects of Tanshinone IIA (Tan IIA) on NSCLC and immortalized lung cells. (A) the chemical structure of Tan IIA. (B) Cytotoxicity of Tan IIA on immortalized HBE, MRC5, and NL20 cells. The cells were treated with Tan IIA for 24 h. Cell viability was measured by MTS assay. (C) MTS assay analyzes the effect of Tan IIA on cell viability of HCC827 (left), H1975 (middle), and A549 (right) cells. (D) Soft agar assay analyzes the effect of Tan IIA on colony formation of HCC827 (top), H1975 (middle), and A549 (bottom) cells. *p<0.01, **p<0.01, ***p<0.001.
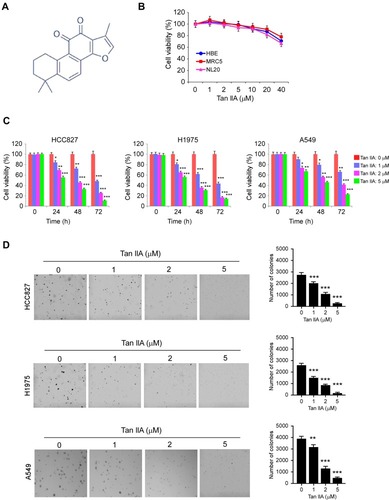
Figure 2 Tan IIA inhibits EGFR signaling. (A) Tan IIA suppresses EGFR signaling in NSCLC cells. Whole-cell extract (WCE) from Tan IIA-treated HCC827 (left), H1975 (middle), and A549 (right) were subjected to immunoblotting (IB) analysis. (B) Tan IIA inhibits EGF-induced EGFR activation. HCC827 cells were starved overnight, and pre-treated with Tan IIA for 2 h. The cells were stimulated with EGF for 30 min, WCE was subjected to IB analysis. (C) Tan IIA down-regulates EGF-induced EGFR activation. HCC827 cells were starved overnight, and pre-treated with Tan IIA for 2 h. The cells were treated with EGF, and WCE was collected with various time points and subjected to IB analysis.
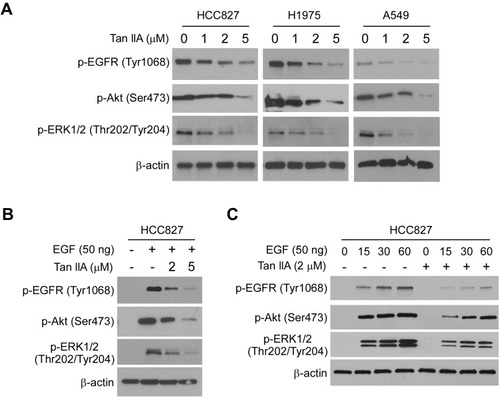
Figure 3 Tan IIA induces apoptosis in NSCLC cells. (A) MTS assay analyzes the cell viability of NSCLC cells treated with multiple small molecular inhibitors and Tan IIA. (B) trypan blue exclusion assay analyzes live cell population of NSCLC cells treated with multiple small molecular inhibitors and Tan IIA. (C) HCC827 cells were treated with Tan IIA, WCE was subjected to IB analysis. (D) HCC827 cells were treated with Tan IIA and subjected to caspase 3 activity analysis. (E) Flow cytometry analyzes apoptosis of HCC827 cells treated with Tan IIA. (F) HCC827 cells were treated with Tan IIA, the subcellular fractions were isolated and subjected to IB analysis. (G) HCC827 cells were treated with Tan IIA, WCE was subjected to IB analysis. *p<0.01, **p<0.01, ***p<0.001.
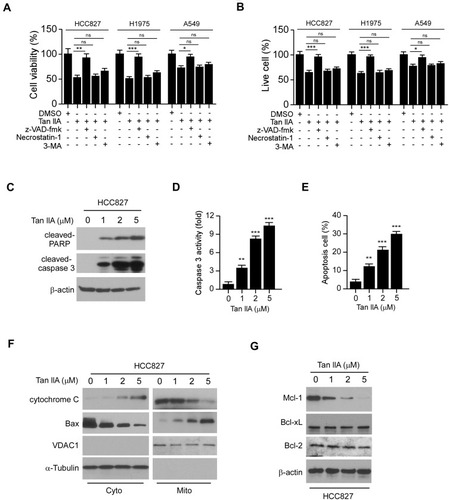
Figure 4 Tan IIA promotes Mcl-1 degradation. (A) NSCLC cells were treated with Tan IIA for 24 h, followed by treated with MG132 for another 6 h. WCE was subjected to IB analysis. (B) qRT-PCR analyzes the mRNA levels of Mcl-1 in Tan IIA-treated NSCLC cells. (C) IB analyzes the half-life of Mcl-1 in Tan IIA-treated HCC827 cells. HCC827 cells were treated with Tan IIA for 24 h, followed by incubation with CHX for various time points. WCE was subjected to IB analysis. (D) Tan IIA promotes Mcl-1 ubiquitination. HCC827 cells were treated with Tan IIA for 24 h, followed by MG132 treatment for 6 h. WCE was collected and immunoprecipitated with Mcl-1 antibody plus agarose A/G beads overnight. Mcl-1 ubiquitination was examined by IB analysis. (E) IB analyzes the half-life of Mcl-1 WT and 5KR mutant in Tan IIA-treated HCC827 cells. HCC827 cells were transfected with Flag-Mcl-1 WT or Flag-Mcl-1 5KR for 24 h. The cells were then treated with Tan IIA for another 24 h and incubated with CHX for various time points. WCE was subjected to IB analysis. (F) IB analyzes the ubiquitination of Mcl-1 WT and 5KR. HCC827 cells were transfected with Flag-Mcl-1 WT or Flag-Mcl-1 5KR, followed by Tan IIA treatment for 24 h. WCE was collected and subjected to immunoprecipitation with Flag antibody and IB analysis. (G and H) MTS assay (G) and trypan blue exclusion assay (H) analysis of cell viability and live-cell population in Tan IIA-treated NSCLC cells with/without Mcl-1 5KR overexpression. (I) Caspase 3 activity of Tan IIA-treated NSCLC cells with/without Mcl-1 5KR overexpression. ***p<0.001.
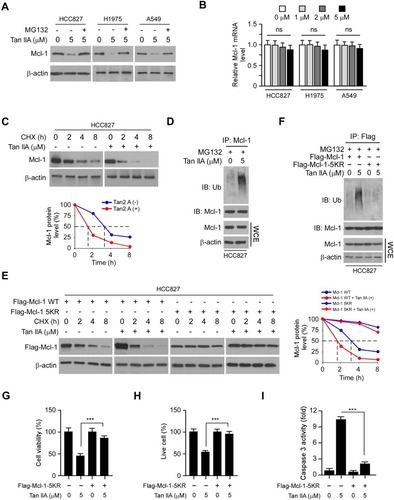
Figure 5 Overexpression of Myr-Akt1 restored Mcl-1 expression and rescued apoptosis in NSCLC cells. (A) HCC827 cells were transfected with Mcl-1 construct and treated with Tan IIA, WCE was subjected to IB analysis. (B and C) MTS assay (B) and trypan blue exclusion assay (C) analysis of cell viability and live-cell population in Tan IIA-treated NSCLC cells with Mcl-1 overexpression. (D) The enzyme activity of caspase 3 in Tan IIA-treated HCC827 cells with Mcl-1 overexpression. (E) HCC827 cells were treated with Tan IIA, PD98059, or LY294002, WCE was subjected to IB analysis. (F) IB analysis of apoptosis in Tan IIA-treated HCC827 cells with Myr-Akt1 transfection. (G–I) MTS assay (G), trypan blue exclusion assay (H), and caspase 3 activity analysis (I) were performed in Tan IIA-treated HCC827 cells with Myr-Akt1 overexpression. (J) HCC827 cells were transfected with Myr-Akt1 and treated with Tan IIA for 24 h. The subcellular fractions were isolated and subjected to IB analysis. *p<0.01, **p<0.01, ***p<0.001.
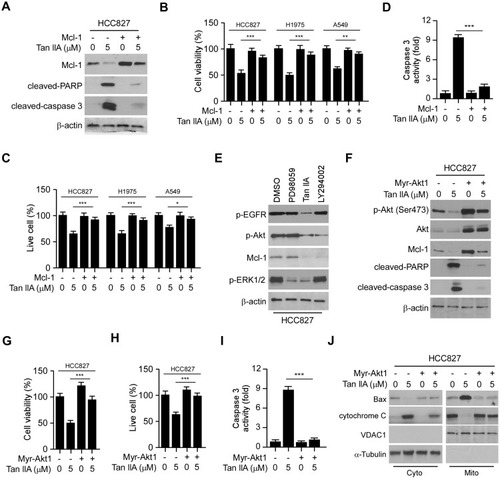
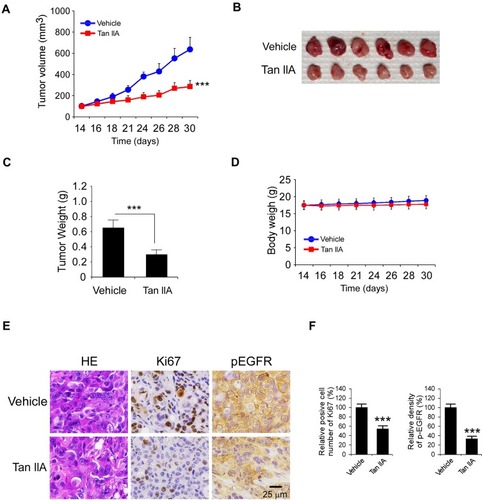
Figure 6 Tan IIA inhibits in vivo tumor growth. (A) The tumor volumes of HCC827-derived xenograft tumors with vehicle or Tan IIA treatment. (B and C) The image of tumor mass (B) and tumor weight (C) of vehicle- or Tan IIA-treated xenograft tumors. (D) The body weight of tumor-bearing mouse with vehicle or Tan IIA treatment. (E) Immunohistochemical staining analysis of ki67 and p-EGFR in vehicle- or Tan IIA-treated xenograft tumors. (F) Qualification of ki67 and p-EGFR staining from (E). ***p<0.001.