3,354
Views
18
CrossRef citations to date
0
Altmetric
Research Article

The UK Clinical Aptitude Test: Is it a fair test for selecting medical students?

, &
Pages e557-e565 | Published online: 29 May 2012

Figures & data

Figure 1. (a) Bar graph of the percentage of respondents who were advised to prepare for the test by a tutor, teacher or career advisor contrasted by the type of school/college a respondent attended. (b) Bar graph of the percentage of respondents who considered their school or college was fully informed about the UKCAT contrasted by the type of school/college a candidate attended. Note: School/college type attended: SFC = Sixth Form College and FEC Further Education College.
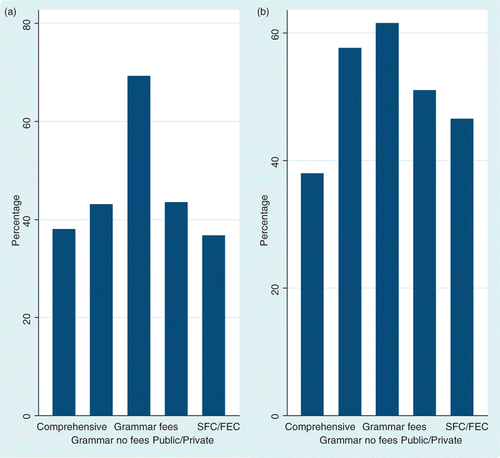
Figure 1. (a) Bar graph of the percentage of respondents who were advised to prepare for the test by a tutor, teacher or career advisor contrasted by the type of school/college a respondent attended. (b) Bar graph of the percentage of respondents who considered their school or college was fully informed about the UKCAT contrasted by the type of school/college a candidate attended. Note: School/college type attended: SFC = Sixth Form College and FEC Further Education College.

Table 1.  Independent predictors of respondent performance on total UKCAT score, model fit statistics total UKCAT score (F (10, 556)) = 8.18 p = 0.0000), R2 = 0.14

Table 2.  Independent predictors of respondent performance in the VR subsection of the UKCAT, model fit statistics (F (13, 552)) = 14.24 p = 0.0000), R2 = 0.25]

Table 3.  Independent predictors of respondent performance in the QR subsection of the UKCAT, model fit statistics (F (13, 552)) = 21.51 p = 0.0000), R2 = 0.33

Table 4.  Independent predictors of respondent performance in the AR subsection of the UKCAT, model fit statistics (F (13, 552)) = 12.06 p = 0.0000), R2 = 0.22

Table 5.  Independent predictors of respondent performance in the DA subsection of the UKCAT, model fit statistics (F (13, 552)) = 11.84 p = 0.0000), R2 = 0.22

Figure 2. The interaction effect between preparation time and type of resource used on total UKCAT score. Notes: UKCAT or commercial defines respondents who used either solely the UKCAT on-line practise test or solely commercial practise resources in their preparation for the test. Both define respondents who use both the UKCAT on-line practise test and commercial practise resources in preparation for the test. Fitted values are the values predicted by the regression model including the interaction term.
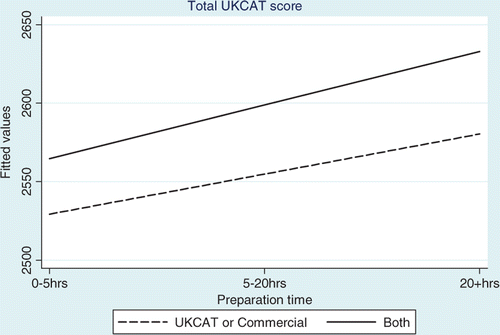
Figure 2. The interaction effect between preparation time and type of resource used on total UKCAT score. Notes: UKCAT or commercial defines respondents who used either solely the UKCAT on-line practise test or solely commercial practise resources in their preparation for the test. Both define respondents who use both the UKCAT on-line practise test and commercial practise resources in preparation for the test. Fitted values are the values predicted by the regression model including the interaction term.

Reprints and Corporate Permissions

Please note: Selecting permissions does not provide access to the full text of the article, please see our help page How do I view content?

To request a reprint or corporate permissions for this article, please click on the relevant link below:

Academic Permissions

Please note: Selecting permissions does not provide access to the full text of the article, please see our help page How do I view content?

Obtain permissions instantly via Rightslink by clicking on the button below:

If you are unable to obtain permissions via Rightslink, please complete and submit this Permissions form. For more information, please visit our Permissions help page.