Figures & data
Figure 1. Decreased cell survival in TAK1 knockdown cells (shTAK1) in comparison to parental cells (shLuc) after HS-exposure. (A) Clonogenic survival assay. Cells were exposed to HS for 15, 30, or 45 min. After 12 days incubation, colonies containing approximately 50 or more cells were counted. Data are presented as mean ± SD (n = 3). *indicates statistical significance compared to shLuc (*p < 0.05, **p < 0.01). (B) Western blots for caspase-3. Control and HS-treated cells were incubated for 24 h before analysis.
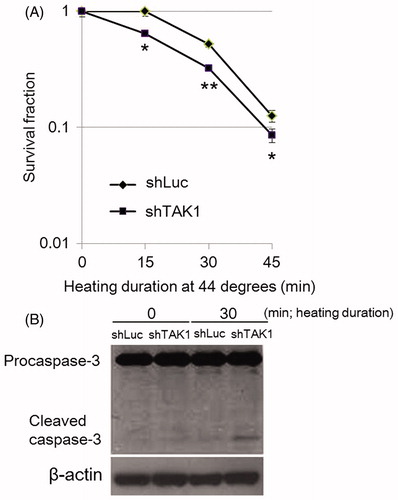
Figure 2. HSP induction and NF-κB phosphorylation in TAK1 knockdown cells in comparison to parental cells exposed to HS. (A) Expression level of TAK1 in control TAK1 knockdown versus its expression in control parent cells. (B) Time-dependent induction of Hsp70, 40, and 27 in cells exposed to HS. (C) Phosphorylation levels of NF-κB induced by HS. Band density was quantified and expressed as fold changes over the untreated control using Image J software.
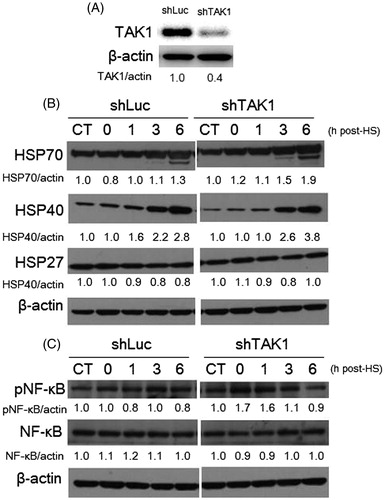
Figure 3. Global gene expression and bioinformatics analyses of TAK1 knockdown cells in comparison to parental cells after HS exposure. (A) The number of differentially expressed genes by a factor of ≥3.0 in HS-treated cells. Venn diagram indicates the commonly and specifically up-regulated genes in each cell line. (B) The identified responsive genetic networks to HS. The up-regulated genes by a factor of ≥3.0 in treated parent cells are included in the networks. Relative gene expression ratios are shown in and II. (C) Differential induction levels of TNFAIP3 and IL-8 proteins in control cells and TAK1 knockdown cells 6 h after HS exposure. Band density was quantified and expressed as fold changes over the untreated control using Image J software.
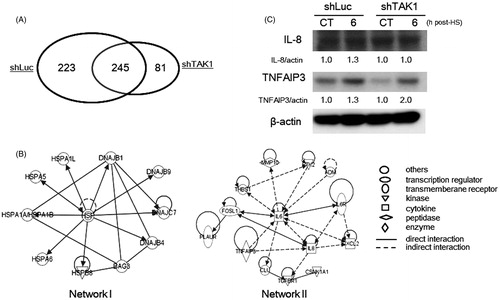
Table I. Relative gene expression levels of differentially expressed genes in identified gene network I.
Table II. Relative gene expression levels of differentially expressed genes in identified gene network II.
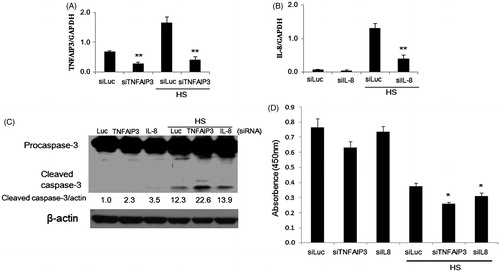
Figure 4. Involvement of TNFAIP3 and IL-8 in apoptosis of HeLa cells exposed to HS. (A, B) Densitometric quantification of TNFAIP3 and IL-8 expression analysed by qPCR following knockdown of TNFAIP3 and IL-8 using siRNAs and / or exposure to HS (44 °C, 30 min). Cells were transfected with siRNA 24 h before HS exposure. (C) Promotion of caspase-3 cleavage by knockdown of TNFAIP3 and IL-8 in cells 24 h after HS exposure. Band density was quantified and expressed as fold changes over the untreated control using Image J software. (D) Depression of cell survival by knockdown of TNFAIP3 and IL-8 in cells 48 h after HS-exposure. Cell survival analysis was performed by CCK-8. Data are presented as mean ± SD (n = 3). *Statistical significance from siLuc with or without HS treatment (*p < 0.05, **p < 0.01).