Figures & data
Figure 1. As shown in this illustration from Knight [Citation19], only the ‘Bottom-up’ attention network is effortless and automatic. ‘Top-down’ attention, memory or visual processing all requires effort. The image is based on electrophysiological studies of the mammalian brain, as referenced by the oscillatory findings given as hertz (Hz) frequencies. Used with permission from Science.
![Figure 1. As shown in this illustration from Knight [Citation19], only the ‘Bottom-up’ attention network is effortless and automatic. ‘Top-down’ attention, memory or visual processing all requires effort. The image is based on electrophysiological studies of the mammalian brain, as referenced by the oscillatory findings given as hertz (Hz) frequencies. Used with permission from Science.](/cms/asset/88293413-7b0c-41cb-b816-0bbc0142ce0f/ibij_a_947627_f0001_b.jpg)
Figure 2. L = Left. The CT image on the left is from the day-of-injury (DOI) and shows focal intraparenchymal haemorrhage in the left frontal lobe with a contrecoup focal haemorrhagic lesion located posteriorly in the right parietal area. By 2 weeks post-injury, focal areas of decreased density deep within the frontal and parietal parenchyma have developed, reflecting damage substantially larger than the original haemorrhagic lesion.
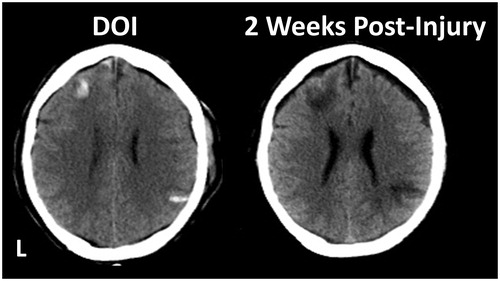
Figure 3. This illustration is from Suchy et al. [Citation66] and demonstrates the dose–response relationship frequently reported between increasingly lower SVT performance and actual neuropsychological test findings [Citation3]. Mean composite WMS-III T-score for individuals in the four groups were calclated: Valid = patients who produced above cut-score SVT performance during initial administration; Improvers = patients who initially produced non-valid SVT performance, but the repeat administration after confrontation yielded valid results; Non-improvers = patients who produced non-valid SVT performance initially and again after confrontation; N-CONF = patients who initially produced non-valid VSVT performance but were not confronted. Reproduced with permission from the author and Psychology Press/Taylor & Francis.
![Figure 3. This illustration is from Suchy et al. [Citation66] and demonstrates the dose–response relationship frequently reported between increasingly lower SVT performance and actual neuropsychological test findings [Citation3]. Mean composite WMS-III T-score for individuals in the four groups were calclated: Valid = patients who produced above cut-score SVT performance during initial administration; Improvers = patients who initially produced non-valid SVT performance, but the repeat administration after confrontation yielded valid results; Non-improvers = patients who produced non-valid SVT performance initially and again after confrontation; N-CONF = patients who initially produced non-valid VSVT performance but were not confronted. Reproduced with permission from the author and Psychology Press/Taylor & Francis.](/cms/asset/ad4717b3-37c5-4e6f-bf40-62ebe0008210/ibij_a_947627_f0003_b.jpg)
Figure 4. As presented by Geier and Luna [Citation111], a simple model emphasizing the interaction between incentive processing and basic cognitive control abilities in decision-making. Sub-optimal decision-making has been suggested to contribute to risk-taking behaviour. In the Geir and Luna model, immaturities in brain systems supporting how incentives are represented in the brain as well as in specific cognitive control systems like working memory and inhibitory control are proposed to underlie poor decision-making. As pertaining to SVT performance, damage within inhibitory control, working memory and/or incentive processing systems may result in SVT errors.
![Figure 4. As presented by Geier and Luna [Citation111], a simple model emphasizing the interaction between incentive processing and basic cognitive control abilities in decision-making. Sub-optimal decision-making has been suggested to contribute to risk-taking behaviour. In the Geir and Luna model, immaturities in brain systems supporting how incentives are represented in the brain as well as in specific cognitive control systems like working memory and inhibitory control are proposed to underlie poor decision-making. As pertaining to SVT performance, damage within inhibitory control, working memory and/or incentive processing systems may result in SVT errors.](/cms/asset/6bc1e9c8-94bf-4e90-9ced-88f63bcbbf9e/ibij_a_947627_f0004_b.jpg)
Figure 5. In this patient who sustained a mTBI, MRI studies performed more than 1 year post-injury show areas of hemosiderin deposition as numerous chronic haemorrhagic lesions (multifocal hypointense regions of dark signal). Note, in association with the hemosiderin depositions are scattered white matter hyper-intense signal abnormalities (white arrows).
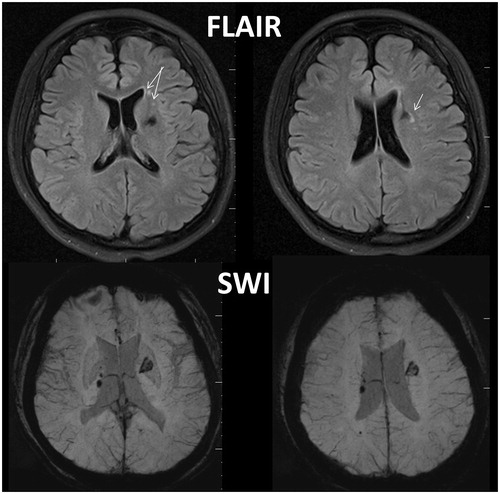
Figure 6. Callicott et al. [Citation137], in an n-back design with non-TBI, typical developed controls manipulated cognitive load and identified the working memory network as shown in the glass brain model. Reproduced with permission from Oxford University Press.
![Figure 6. Callicott et al. [Citation137], in an n-back design with non-TBI, typical developed controls manipulated cognitive load and identified the working memory network as shown in the glass brain model. Reproduced with permission from Oxford University Press.](/cms/asset/4f50b89b-5686-47c5-bbc7-1a37da82cf5f/ibij_a_947627_f0006_b.jpg)
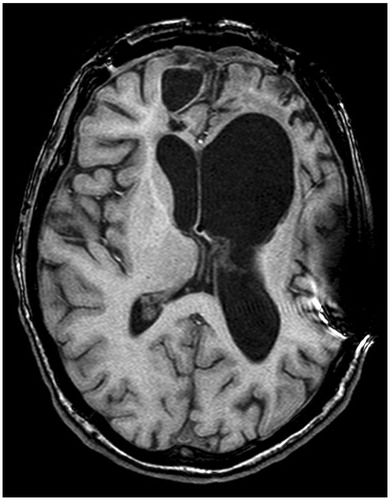
Figure 7. T1 weighted image of extensive damage in severe TBI where the patient either performed without error or only made one error across three SVT measures. The scan is in radiological perspective with left on the viewer’s right. Note that, despite the distinct bifrontal pathology, this patient with severe structural damage had no difficulty passing all SVT measures administered.