Figures & data
Figure 1. An unsupervised hierarchical clustering of normalized data from SiHa and FaDuDD cells treated with hypoxia and low pH.
Figure 2. Separating pH independent hypoxia upregulated genes in SiHa and FaDuDD cells. The grouping of samples for the multiclass SAM analysis enabling a hierarchical clustering (median centered genes, complete linkage) of data. Red is upregulated, green is down regulated.
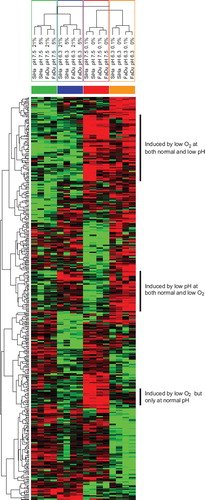
Figure 3. Expression of CA9, HIG2, NDRG1, PAI-1 and RORA in FaDuDD xenograft tumors from mice exposed to either 10% oxygen (hypoxia group) or atmospheric air (control) measured by qPCR. Expression levels are normalized to expression of the housekeeping gene TFRC. Expression of GUSB is measured as control. Each point represents an individual mouse tumor; horizontal bar is the average value.
Figure 4. Expression of HIG2, NDRG1, PAI-1 and RORA in A) UTSCC5 B) UtScc14 and C) UTSCC15 cells at different oxygen concentration at either normal pH (•) or low pH (○) measured by qPCR. Expression levels are normalized to expression of the housekeeping gene TFRC, and represented relative to expression levels at 21% O2. Results show mean (+/−. 1 S.E.) from three independent experiments.
Figure 5. Heat map of the 27 genes that was found as hypoxia induced, pH unaffected in three of four cell lines. The colour bar is showing the fold change relative to the median expression of each gene across all cell lines and conditions.
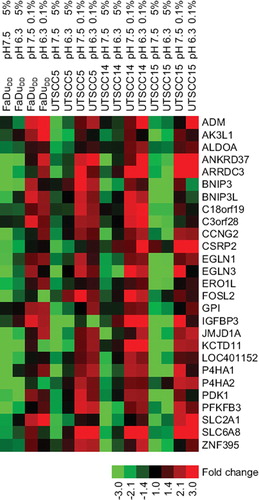
Table I. The genetic networks affected in hypoxic, acidic cells.