Figures & data
Figure 1. Pre-contrast cone beam CT images (grayscale) overlaid with contrast enhancement images (post-contras minus pre-contrast, color wash) for the five treatment sessions for which contrast-enhanced cone beam CT was performed (fractions 1, 3, 5, 7, and 10). The tumor contour for each image set is shown in blue.
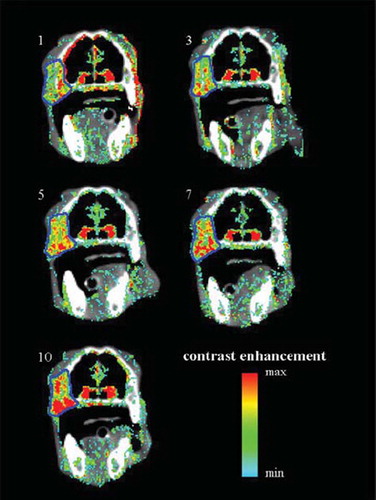
Figure 2. The IMRT dose plan for treatment fraction 1. The GTV is shown in blue and the PTV in pink. The prescribed dose to the GTV was 46 Gy and the prescribed dose to the PTV 40 Gy.
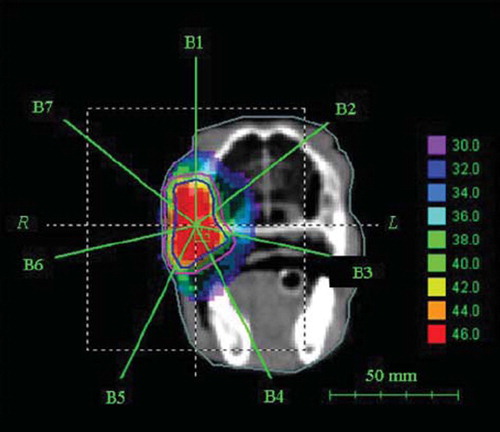
Figure 3. Patient repositioning based on co-registering bony anatomy (upper row) and contrast enhancement (lower row). Cone beam CT images and contrast enhancement images from treatment session 3 are matched to their respective images taken at treatment session 1. The tumor contour is shown in blue.
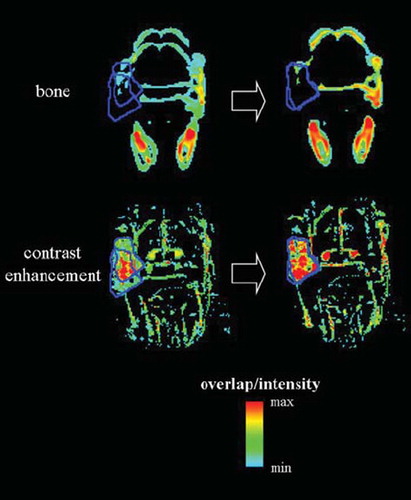
Table I. Translation vectors for patient repositioning following bone and contrast-enhancement (CE) matching of cone beam CT images
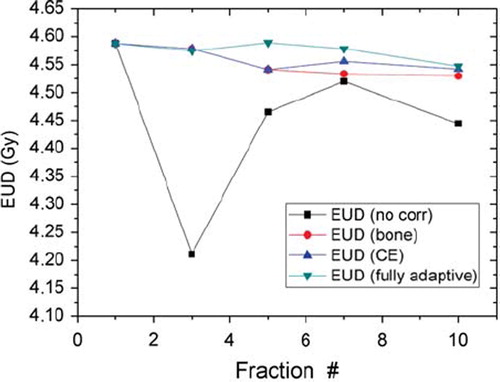
Figure 4. Equivalent uniform dose (EUD) for the dose distributions resulting from the four different treatment strategies; fully adaptive (green), patient repositioning based on matching of contrast enhancement matrices (blue), patient repositioning based on matching of bony anatomy (red) and no repositioning or treatment adaptation (black).