2,130
Views
50
CrossRef citations to date
0
Altmetric
Research Article

Inter- and intrafractional localisation errors in cone-beam CT guided stereotactic radiation therapy of tumours in the liver and lung

, , , , &
Pages 1177-1183 | Received 19 May 2010, Accepted 27 May 2010, Published online: 30 Jun 2010

Figures & data

Figure 1. The magnitude of the interfractional baseline shift (3D) for each treatment fraction of the patients treated for lung tumours.

Figure 1. The magnitude of the interfractional baseline shift (3D) for each treatment fraction of the patients treated for lung tumours.

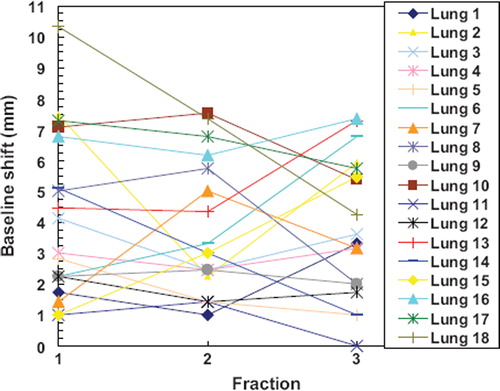
Table I. Inter- and intra-fraction PPE for the 15 patients treated for liver tumours.

Table II. Interfraction alignment errors of bony anatomy, tumour, and baseline for the 19 patients treated for lung tumours.

Table III. Intrafraction alignment errors of bony anatomy, tumour, and baseline for the 19 patients treated for lung tumours.

Table IV. PTV margins required to account for the determined inter- and intra-fractional systematic and random localisation errors of the patients treated for lung tumors.

Figure 2. Interfraction mean PPE (3D) as a function of patient BMI. Patients treated without abdominal compression are marked with filled circles and triangles. Upper outliers are marked with arrows (upper fence = 10.6 mm). The correlation is significant when patients treated without compression are included (rs = 0.44, p = 0.014), but not if they are excluded from the data set (rs = 0.19, p = 0.37). A straight line is fitted to all of the data points (Pearson correlation coefficient r = 0.56).

Figure 2. Interfraction mean PPE (3D) as a function of patient BMI. Patients treated without abdominal compression are marked with filled circles and triangles. Upper outliers are marked with arrows (upper fence = 10.6 mm). The correlation is significant when patients treated without compression are included (rs = 0.44, p = 0.014), but not if they are excluded from the data set (rs = 0.19, p = 0.37). A straight line is fitted to all of the data points (Pearson correlation coefficient r = 0.56).

Figure 3. Mean interfractional baseline shift (3D) of the lung tumours as a function of the distance between the tumour and the spinal cord as measured on the planning CT (rs = 0.74, p < 0.001, including both patients treated with and without abdominal compression). A straight line is fitted to the all of the data points (Pearson correlation coefficient r = 0.70).

Figure 3. Mean interfractional baseline shift (3D) of the lung tumours as a function of the distance between the tumour and the spinal cord as measured on the planning CT (rs = 0.74, p < 0.001, including both patients treated with and without abdominal compression). A straight line is fitted to the all of the data points (Pearson correlation coefficient r = 0.70).

Reprints and Corporate Permissions

Please note: Selecting permissions does not provide access to the full text of the article, please see our help page How do I view content?

To request a reprint or corporate permissions for this article, please click on the relevant link below:

Academic Permissions

Please note: Selecting permissions does not provide access to the full text of the article, please see our help page How do I view content?

Obtain permissions instantly via Rightslink by clicking on the button below:

If you are unable to obtain permissions via Rightslink, please complete and submit this Permissions form. For more information, please visit our Permissions help page.