1,034
Views
41
CrossRef citations to date
0
Altmetric
Research Article

Feasibility of dose painting using volumetric modulated arc optimization and delivery

, , , , &
Pages 964-971 | Received 21 May 2010, Accepted 28 May 2010, Published online: 13 Sep 2010

Figures & data

Figure 1. (a) The Cu-ATSM PET image for the patient, (b) the dose prescription map, (c) the substructures corresponding to five dose prescription levels, (d) an example of the optimised dose.

Figure 1. (a) The Cu-ATSM PET image for the patient, (b) the dose prescription map, (c) the substructures corresponding to five dose prescription levels, (d) an example of the optimised dose.

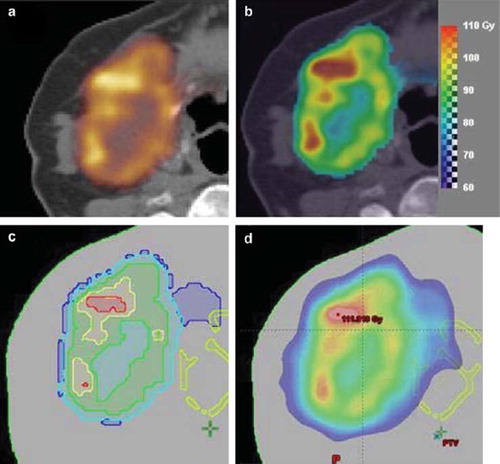
Table I. Mean doses (in Gy) for the target substructure sets. Used as prescription doses in the level-based approach, and as target optimization objectives in Eclipse.

Figure 2. Quality volume histograms for: (upper left) all the number of dose prescription levels used (with default settings of the optimisation paramenters); 11 levels (solid line), 9 levels (dashed line), 7 levels (dotted line), 5 levels (dash-dot line), 3 levels (thin solid line), (lower left) 11 dose prescription levels for one (dotted line) and two (solid line) arcs, (lower right) 11 dose prescription levels for MLC width 2.5 mm (solid line) and 5 mm (dotted line), (upper right) 11 dose prescription levels for collimator rotations 45(315) (solid line), 30(330) (dashed line), 15(345) (dotted line) and 0(0) (dash-dot line).

Figure 2. Quality volume histograms for: (upper left) all the number of dose prescription levels used (with default settings of the optimisation paramenters); 11 levels (solid line), 9 levels (dashed line), 7 levels (dotted line), 5 levels (dash-dot line), 3 levels (thin solid line), (lower left) 11 dose prescription levels for one (dotted line) and two (solid line) arcs, (lower right) 11 dose prescription levels for MLC width 2.5 mm (solid line) and 5 mm (dotted line), (upper right) 11 dose prescription levels for collimator rotations 45(315) (solid line), 30(330) (dashed line), 15(345) (dotted line) and 0(0) (dash-dot line).

Table II. Tabulation of Q0.95–1.05 for combinations of physical parameters for level-based dose painting for optimisation with 11 dose levels.

Figure 3. Magnitudes of Q0.95–1.05 for the default settings of optimisation parameters for all numbers of dose prescription levels for no positional shift (circles), shift of 1 mm in all directions (squares), and shift of 2 mm in all directions (diamonds).

Figure 3. Magnitudes of Q0.95–1.05 for the default settings of optimisation parameters for all numbers of dose prescription levels for no positional shift (circles), shift of 1 mm in all directions (squares), and shift of 2 mm in all directions (diamonds).

Reprints and Corporate Permissions

Please note: Selecting permissions does not provide access to the full text of the article, please see our help page How do I view content?

To request a reprint or corporate permissions for this article, please click on the relevant link below:

Academic Permissions

Please note: Selecting permissions does not provide access to the full text of the article, please see our help page How do I view content?

Obtain permissions instantly via Rightslink by clicking on the button below:

If you are unable to obtain permissions via Rightslink, please complete and submit this Permissions form. For more information, please visit our Permissions help page.