Figures & data
Table I. Patient characteristics and their association with post-RT outcome in univariate analysis. Comparison of groups with residual disease and with complete metabolic response.
Figure 1. Kaplan-Meier estimates of overall survival of patients with residual metabolically active areas and with complete metabolic response on the post-radiotherapy PET-CT scan. Patients with residual metabolically active areas had significantly worse survival (p = 0.0001).
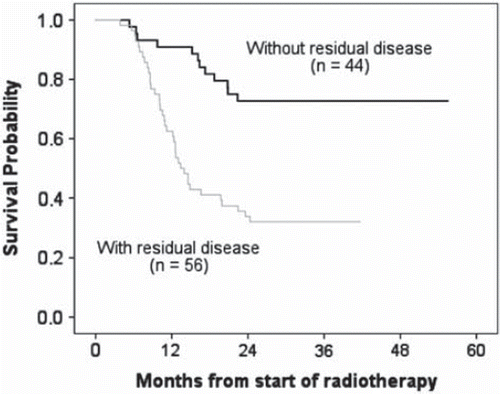
Figure 2. Survival among patients with advanced NSCLC for selected variables. For continuous variables, the cut-off value to stratify the patients was defined at the variable median. Shown are Kaplan-Meier curves for GTVprimary, SUVmax, OTT, EQD2, T, TNM stage and age. In panel E, patients with stage I and II were grouped together due to the small number of cases. Stage IV (1 patient) was grouped with Stage IIIB.
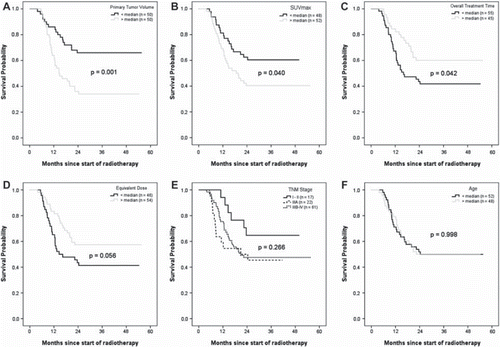
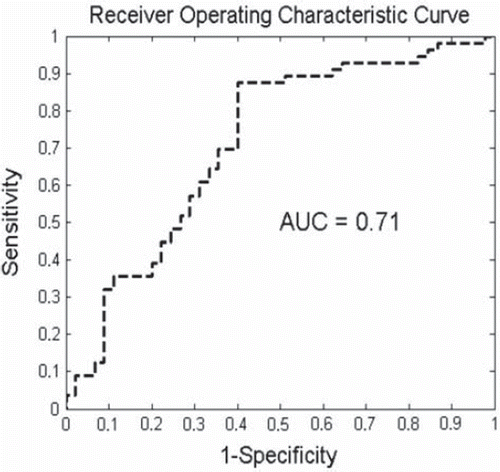
Figure 3. Area under the ROC curve assessed by the leave-one-out method for the multivariate model consisting on GTVprimary, SUVmax, OTT and EQD2, T. A classifier with sensitivity of 1 and (1-specificity) of 0, point (0, 1) in graph, is ideal.