Figures & data
Figure 1. The two sections of the multi–modality phantom used, here aligned with the setup positioning lasers on the treatment couch prior to CBCT scan.
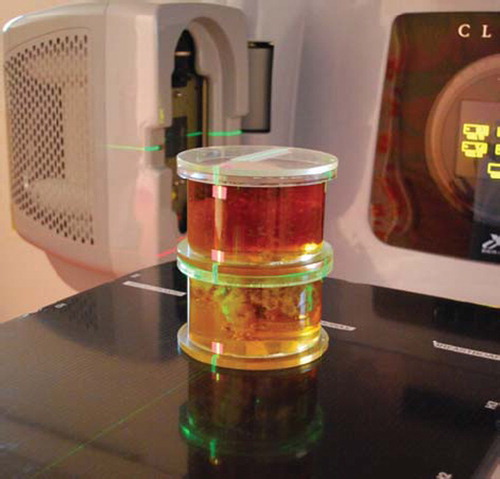
Figure 2. A CT image of the two phantom sections used also showing the delineation into a Body structure, the upper section (Box 1) and lower section (Box 2). In the upper section the fish oil capsules are clearly visible along with small air encapsulations. The bright area in the left side of the lower section is a part of pre-hardened polyurethane containing a solution of BaSO4.
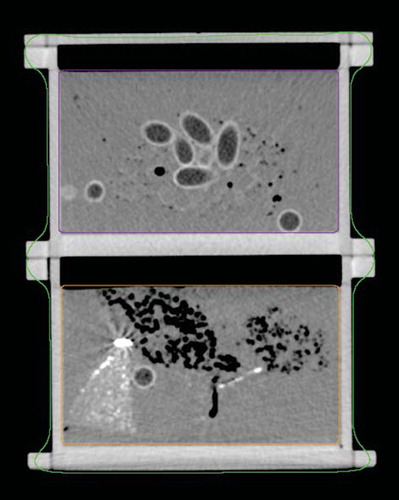
Table I. Automatching parameters available for customization on the OBI. Selected settings are highlighted with italic.
Table II. Mean and standard deviations for the vertical, longitudinal and lateral errors for CT-CBCT and MRI-CBCT automatching.
Figure 3. Box plots showing the error distribution in the vertical, longitudinal and lateral directions for CT-CBCT and MRI-CBCT automatching, respectively. The plots contain all data points for both structures (Box 1 and Box 2). The whiskers extend from the minimum and maximum value. The box limits represents the 25th and 75th percentiles and the black lines the sample median.
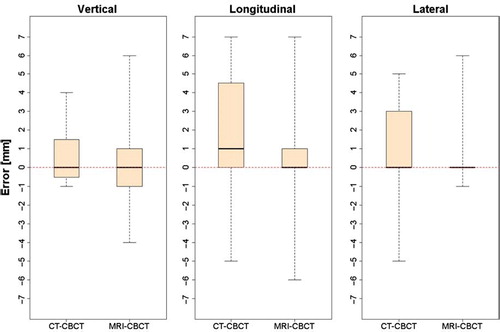
Figure 4. Absolute difference in couch shift coordinates [mm] between CT-CBCT and MRI-CBCT automatching for the vertical, longitudinal and lateral directions. Data from all three patients are plotted and separated by the two vertical lines.
![Figure 4. Absolute difference in couch shift coordinates [mm] between CT-CBCT and MRI-CBCT automatching for the vertical, longitudinal and lateral directions. Data from all three patients are plotted and separated by the two vertical lines.](/cms/asset/608e12c6-231e-41c3-995e-ff726427d90b/ionc_a_498442_f0004_b.jpg)