Figures & data
Figure 1. Flow diagram of array CGH technology for determining sub-chromosomal losses and gains within the prostate cancer genome (see text for details). Areas of tumor tissue are micro-dissected within pre-treatment biopsies based on a pathologist's markings. DNA is then extracted from the dissected tissue and subjected to aCGH hybridization. The aCGH “hits” are defined by fluorescence-based, image analysis software. Allelic losses and gains can be validated within the same patient's tissues, or amongst groups of patients, using loci-specific fluorescent-in-situ-hybridization (FISH). The final aCGH validated “hits” can be compared between responders and non-responders to radiotherapy to develop novel prognostic and predictive factors.
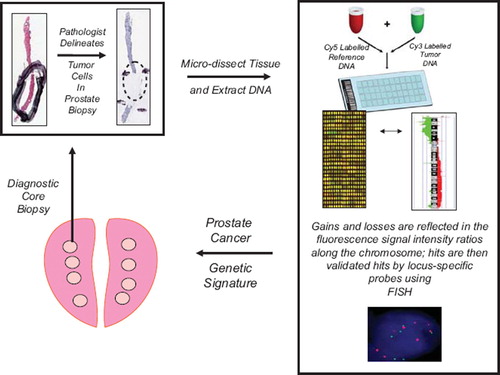
Figure 2. Summary of DNA copy number gains (red) and losses (green) from 24 intermediate risk prostate samples (adapted from Ishkanian et al. 2009). The values of 0.5 and −0.5 indicates a level of 50% frequency gain or loss, respectively. Regions of copy number alteration containing genes associated with both prostate cancer and tumor cell radiosensitivity are shown.
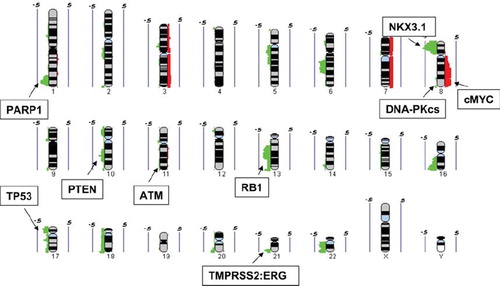
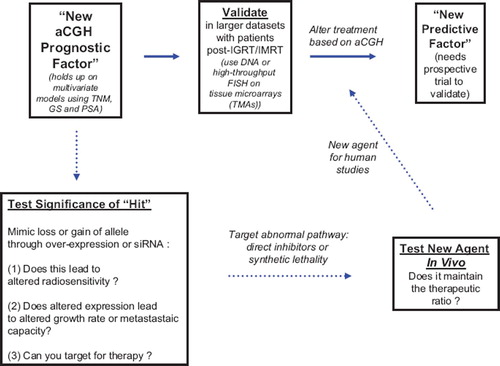
Figure 3. Flow diagram of authors’ approach to iterating “hits” from aCGH studies in prostate cancer into prognostic and predictive factors and using the same information to develop novel targeting strategies in prostate cancer treatment.