Figures & data
Figure 1. Workflow diagram illustrating the different steps to obtain dose and volume parameters from daily CBCT image sets (total number N) using a treatment planning system (left) and a deformable image registration software (right). See text for details. pCT = planning CT; CBCTfxX = cone-beam CT acquired at fraction X; structuresX = structures propagated from planning CT to image set acquired at fraction X; pCTdeftoCBCTfxX = planning CT deformed to anatomy of cone-beam CT acquired at fraction X.
Figure 2. Three corresponding axial slices showing (a) planning CT with structures; (b) cone-beam CT acquired at fraction 33 with propagated structures from planning CT after deformable image registration; (c) planning CT deformed to anatomy of cone-beam CT acquired at fraction 33. Structures shown are clinical target volume 1 (CTV1) (brown); CTV2 (red); CTV3 (orange); spinal cord (cyan) with planning risk volume (blue); parotid (green) and submandibular (yellow) glands.
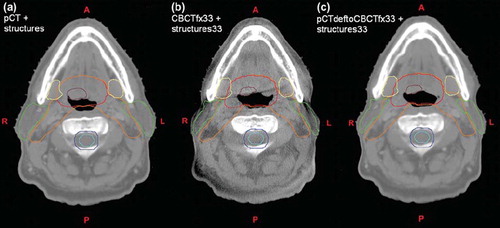
Figure 3. Axial CBCT slices with examples of propagated deformed contours evaluated as acceptable. (a) Left parotid with minor inconsistent segmentation. (b) Left submandibular gland contour going slightly into level II nodal volume. (c) Inconsistent overlap between spinal cord (cyan) and brain stem (light green).
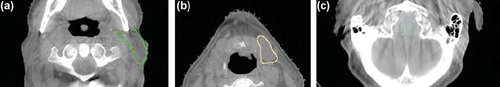
Figure 4. Parotid glands: (a) Ratio of volume and mean dose for each fraction to initial treatment planning. (b) Ratio of accumulated daily mean dose to initially planned total mean dose (indicated by straight line). Insert shows dose difference between accumulated and planned mean dose.
Figure 5. Maximum dose to spinal cord (SC) and brain stem (BS) with associated planning risk volumes (PRVs) for each fraction represented by dose to the maximum 1% of the volume (D1%).
Figure 6. Target volumes: (a) Absolute volume of the three CTVs over time. (b) Absolute volume of CTV1, GTV primary tumour and GTV lymph nodes over time (c) Ratio of volume for each fraction to the initial treatment planning. (d) Fractional volume receiving 95% and 99% of prescription dose which equals 66 Gy (100%), 60 Gy (90.9%) and 50 Gy (75.8%) for CTV1, CTV2 and CTV3, respectively (note break on y-axis). Abbreviations: CTV = clinical target volume; GTV = gross tumour volume; PT = primary tumour; LN = lymph nodes; VXX% = fractional volume (%) receiving XX% of prescribed dose.