Figures & data
Figure 1. Simulated relative fluence of a 126 MeV primary antiprotons beam from the AD-4 beam line entering a water target. The contributions of secondary protons, pions, and neutrons along the beam axis are also shown. Heavier particles are not shown here since they would only be visible at the end of the primary beam trajectory, due to the linear scale on the ordinate axis.
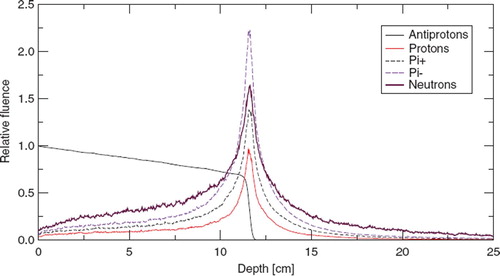
Figure 2. Example of the automatic glow curve deconvolution for a TLD-700 equivalent pellet. The raw glow curve (“+” marks) is recorded a few hours after irradiation with 4 Gy of 6 MV X-rays. 5 peaks are deconvoluted in this example, but only the main peak at ∼500 K which is the so-called “peak 5” is used for further data processing.
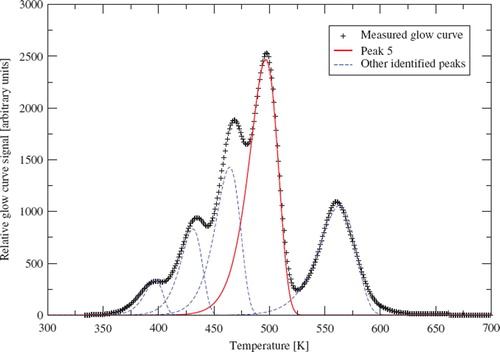
Figure 3. The AD-4/ACE beam line at the antiproton decelerator at CERN with the thermal neutron phantom (the white plastic cylinder seen on the right). The antiproton beam enters the phantom from the left. Also seen on the image is the aluminum block holding the phantom. It has a hole which can let the beam pass unhindered. The box in front of the alumium holder, contains a thin scintilator foil which is monitored by a CCD camera (mounted at the top of the slant tube).
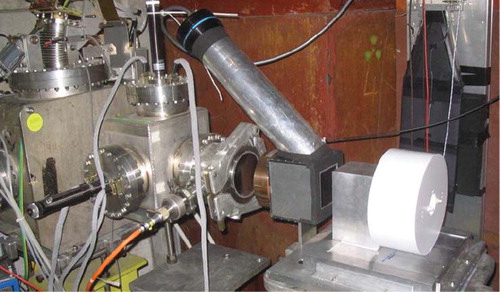
Figure 4. Technical drawing of the polystyrene neutron phantom, as seen from the beam (left) and from the side (right). On the right side, also the polystyrene annihilation target is shown in the center of the disks. The TLDs are located in disk number 7, 8, 9 and 10, counting downstream the beam direction. All dimensions are in mm.
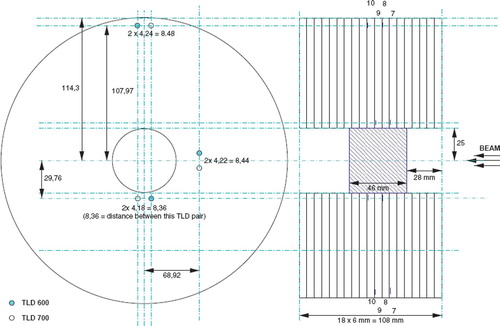
Figure 5. Top: 6LiF and 7LiF responses as a function of distance to annihilation vertex. k = 0.124 GyE mm2. Bottom: difference in TLD 600 and TLD 700 responses in terms of thermal neutron fluence. a0 = 2.86 · 105. All results are absolute measurements expressed per 107 antiproton annihilation. Error bars do not include a possible systematic underestimation of up to 20%.
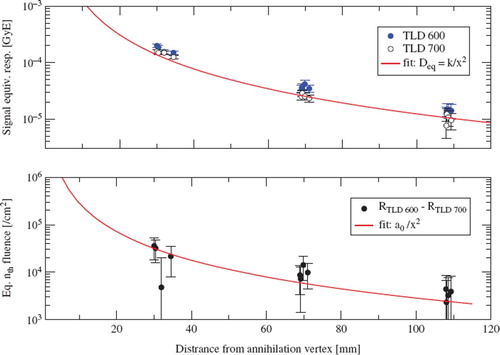
Table I. Measured response of TLDs expressed in dose equivalent signal.
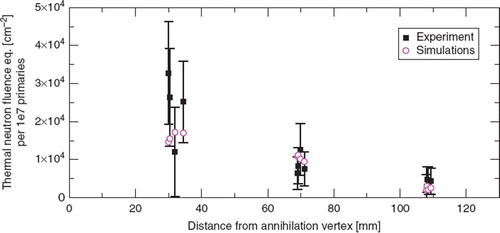
Figure 6. Measured and simulated thermal neutron fluence as a function of distance from the annihilation vertex inside the polystyrene phantom.