Figures & data
Figure 1. Late time PET hypoxia scans in tumor-bearing mice provides a quantitatively accurate measure of the density of hypoxic cells. Left column: pimonidazole stained tumor section, second column: segmented pimonidazole image showing the distribution of pimonidazole-positive cells (pO2 < ∼10 mmHg). Third column: FAZA autoradiogram obtained from the same tissue section. Last column: scatterplot showing the spatial relationship between average FAZA signal and relative area covered by hypoxic cells derived by a pixel-by-pixel (2×2 mm) comparison between the segmented pimonidazole image and the FAZA autoradiogram. Upper row: UT-SCC-33, middle row: SiHa, lower row: SCCVII.
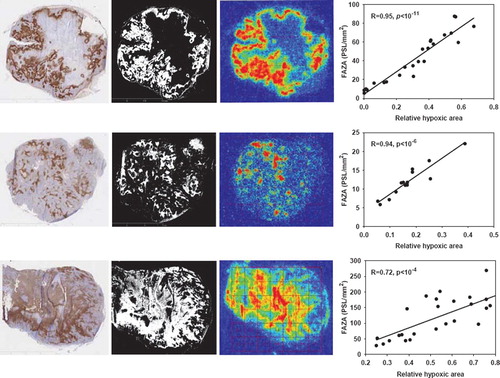
Figure 2. PET image-derived input functions (left column) and whole-tumor TACs (right column) for mice carrying tumors in both flanks. Upper row: TACs for two UT-SCC-33 flank tumors (filled and open circles, respectively). Middle: TACs for two SiHa flank tumors and lower row: TACs for two SCCVII flank tumors. Part of the input function is included in the whole-tumor TAC figures.
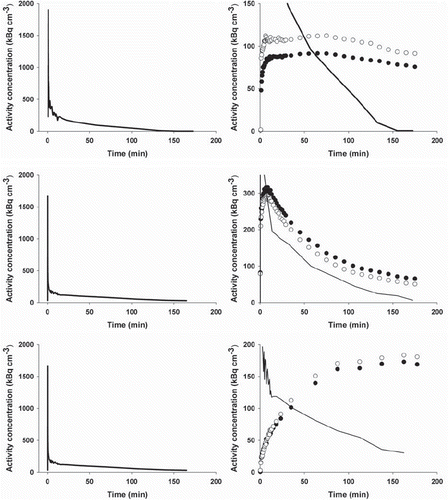
Figure 3. TACs derived from six to eight rectangular VOIs each with a size of 2.5×2.5×3.7 mm placed in different tumor regions representing areas differing in late time FAZA concentration. TACs are presented for the whole scan (left column) and first 20 min of the scan (right column), which allows for easy comparison between early tumor tracer influx and late-time tracer retention.
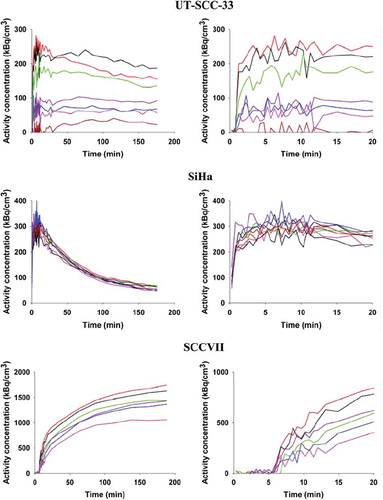
Figure 4. Comparison between arterial blood activities measured in blood samples derived from a catheter in the carotid artery and PET image-derived activity values obtained from a 15 mm3 VOI placed in the heart cavity as identified on the first or second 5 s frame following tracer administration. PET images: The vena cava and heart cavity is clearly visible in the early images. The graph shows the radioactivity ratio between a VOI positioned in a blood pool in the heart cavity and blood samples drawn from the carotid artery in two (open and closed circles respectively) catheterized mice.
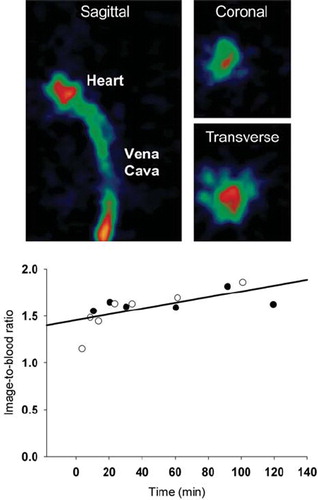
Figure 5. Examples of fits obtained in the three tumor models: UT-SCC-33 (top), SiHa (middle), SCCVII (bottom). Dynamic PET data up to 3 h from whole tumor VOIs are shown as open circles. The best fits using an irreversible two-tissue compartment model are shown as solid lines.
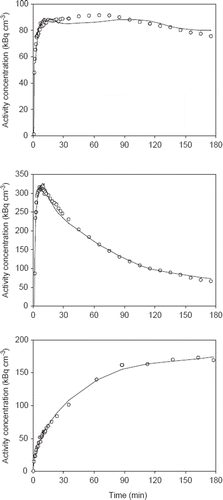
Table I. Selected rate constants for three different tumor models derived from kinetic analysis of whole-tumor TACs. The number in brackets denotes standard deviations.
Figure 6. Comparison between the 3 h FAZA signal derived from the last PET image frame (170 to 180 min) and tracer trapping rate constant (k3) or the influx rate constant from plasma into irreversible bound tracer (Ki) in three different tumor models. Three different TAC time intervals (60, 120, 180 min) were used for model fitting.
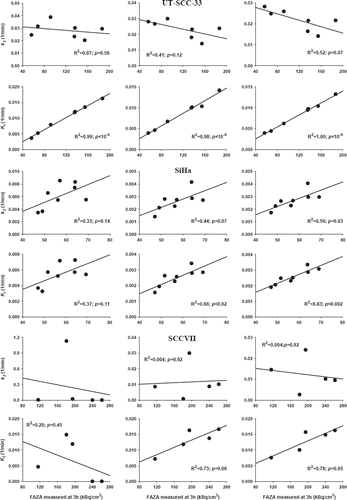
Table II. Pearson regression coefficients and p-values obtained when plotting k3 and Ki values as a function of FAZA concentration at 3h for multiple tumor sub-volumes (for tumors not shown in ).